10 common Machine Learning mistakes and how to avoid them
Data, modeling and process issues can hold your machine learning efforts back—but they don't have to

I’ve worked for several decades in the field of machine learning, on projects ranging from algorithmic trading at Morgan Stanley, to IBM’s Watson, which won the Association for the Advancement of Artificial Intelligence’s Feigenbaum Prize, to Capital One’s Eno, our natural language assistant that answers your questions and looks out for you and your money 24/7. While doing these and other projects, I’ve observed a number of pitfalls that commonly occur. To help you succeed at your machine learning projects, I thought it would be good to discuss these machine learning pitfalls and how to avoid them. I’ll discuss ten mistakes often made in machine learning, loosely grouped into three sections based on the type of issue at hand:
- Data issues
- #1 - Not Looking at the Data
- #2 - Not Looking for Data Leakage
- Modeling issues
- #3 - Developing to the Test Set
- #4 - Not Looking at the Model
- #5 - Not Comparing to a Simple Baseline Model
- Process issues
- #6 - Not Qualifying the Use Case
- #7 - Not Understanding the User
- #8 - Developing Technology for Technology’s Sake
- #9 - Not Using Existing Solutions
- #10 - Not Performing Failure Analysis
Let’s start with the data issues.
Data issues in Machine Learning
Data issues are important, because machine learning models are trained, tested, and applied to data. There are two main issues when it comes to data in machine learning: not looking at the data and not looking for data leakage.
Common Machine Learning mistake #1: Not looking at the data
If you don’t look at the data carefully, you may miss useful insights. English statistician Francis Anscombe was famously known for Anscombe’s quartet—an example of four datasets that have nearly identical descriptive statistics—mean, variance, correlation, regression line, R squared—yet have very different distributions and appear very differently when graphed.

Example of Anscombe’s quartet. Source: https://en.wikipedia.org/wiki/Anscombe%27s_quartet
It can also be very easy to fool yourself if you select your data in an inappropriate way. For example, if you select on values of the dependent variable, you may get a misleading estimate of the true relationship between the independent and dependent variables.

Source: https://rowman.com/WebDocs/Chapters1-4.pdf
In the above (simulated) dataset of cases taken from “Claiming Too Much: Warnings about Selection Bias” by David Collier, James Mahoney, and Jason Seawright, you can see that performing linear regression using only the cases in which the government has high performance—those whose dependent variable Y is greater than 120—produces a significantly different regression line than when performing linear regression using all cases.
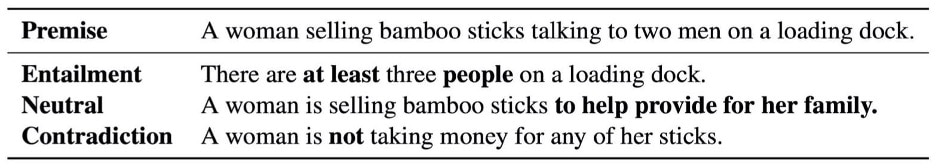
One particularly annoying problem is that annotation artifacts can sometimes creep into data. This happened in the natural language inference (NLI) challenge in computational linguistics, also known as recognizing textual entailment (RTE). The NLI task, launched in 2004, consists of taking a Premise and Hypothesis as input and producing Entailment, Neutral, or Contradiction as output. Many years later, in 2018, researchers at University of Washington/Carnegie Mellon University/Allen Institute for Artificial Intelligence/New York University, Johns Hopkins/Birla Institute of Technology and Science, Pilani, and Toyohashi University of Technology noticed that the NLI datasets contained artifacts that allowed the NLI task to be performed by looking only at the Hypothesis and not the Premise.
Data for the NLI task was generated by starting with a Premise and then having human crowdworkers construct Hypotheses to be classified as Entailment, Neutral, and Contradiction. For example, given the Premise “A woman selling bamboo sticks talking to two men on a loading dock,” the Hypothesis “There are at least three people on a loading dock” was constructed to be classified as Entailment.
Annotation Artifacts in Natural Language Inference Data. Source: https://arxiv.org/abs/1803.02324
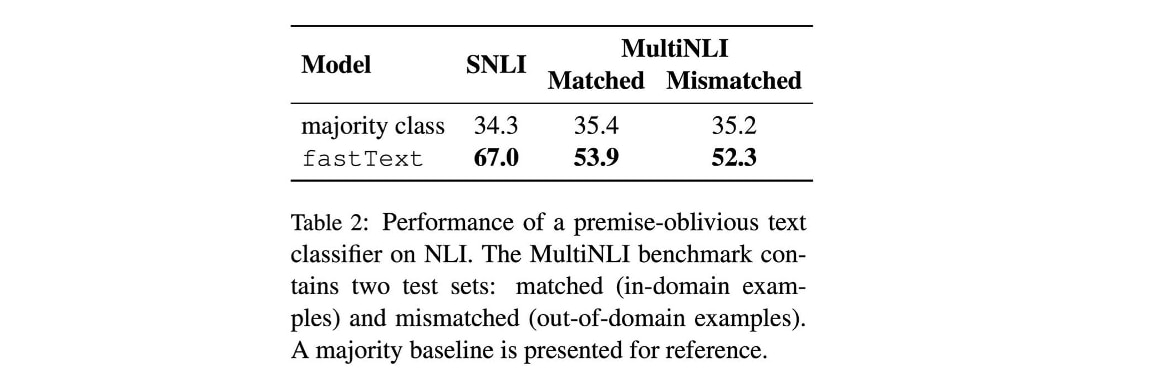
Unfortunately, certain words and phases—those shown in bold—were telltale signs that the Hypothesis was of a certain class. The word “not” in the Hypothesis turned out to be a clue that the correct class was Contradiction, irrespective of the Premise. The table below shows that performance significantly better than baseline could be obtained simply by looking at the Hypothesis, with no access to the Premise at all.
Annotation Artifacts in Natural Language Inference Data. Source: https://arxiv.org/abs/1803.02324
Solution - How to look at data
- Use exploratory data analysis (EDA) techniques, both non-graphical (such as mean, variance, min, max, and correlation matrices) and graphical (such as scatterplot, histogram, heatmap, and dimensionality reduction).
- Look carefully for things like data errors, missing data, fields that are always the same value, duplicate instances, unbalanced data, sampling bias, selection on the dependent variable, and easily gamed data.
- Verify that fields contain the data you expect them to contain. Check that the data is representative of the data the model will see in production. For classification problems, make sure there are enough instances for each class in each split.
- Talk with data creators and owners to better understand the data. Bring a list of questions about the data.
Common Machine Learning mistake #2: Not looking for data leakage
Data leakage occurs when a training dataset contains information or clues that won’t be available at the time of prediction. An example of data leakage can be seen in the Kaggle competition entry below, where Area Under the Curve (AUC) went from 0.9973 to 0.59 after three types of leakage were discovered and removed (higher AUC is better).
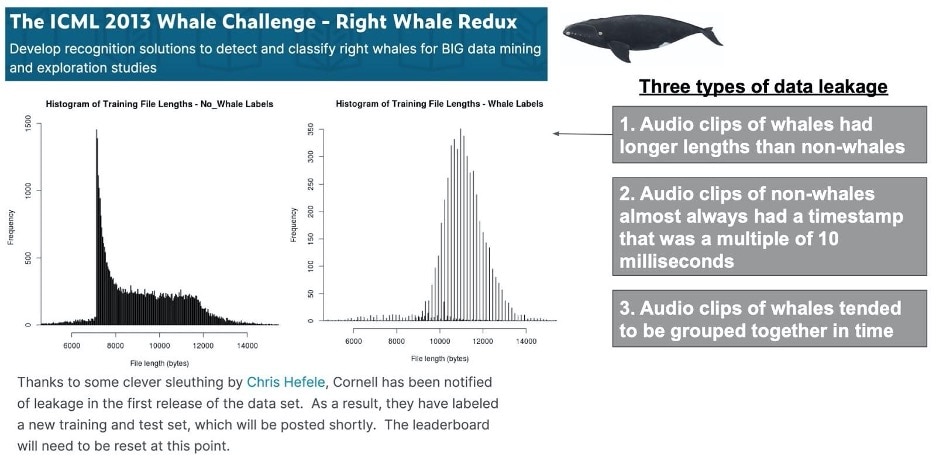
The ICML 2013 Whale Challenge - Right Whale Redux. Source: https://www.kaggle.com/c/the-icml-2013-whale-challenge-right-whale-redux/discussion/4865
Solution - How to avoid data leakage
- In my opinion, as a general rule of thumb, if your results are extremely good—say greater than around 90% for various metrics—you may want to suspect data leakage.
- At the very beginning, split your data into the sets you’ll need in the project: train, validation, development, test, blind, folds, and so on. Split your data before doing exploratory data analysis, and split it before data preparation, including normalization of values, imputation of missing values, removing outliers, dimensionality reduction, and feature selection. Set aside several blind datasets to use for final evaluation. Once you use a blind dataset, it’s no longer blind.
- When using k-fold cross-validation, perform data preparation separately within each fold.
- Look at measures of feature importance to identify features that might be leaky, such as correlation of feature with dependent variable (informativeness), regression feature weights, R squared, and permutation feature importance (decrease in performance after shuffling the feature values).
- Look for duplications in the data, and look for identical instances present in multiple splits.
- Look carefully at the properties of every data element.
- Identify the order in which data elements become available. Use only information from the past for prediction. Avoid lookahead. Don’t use information from the future.
- Remove leaky features from the set of independent variables. Work with data providers to improve data documentation and reduce data leakage.
Modeling issues in Machine Learning
Selecting and training models using data is the heart of machine learning. There are three main issues when it comes to modeling in machine learning: developing to the test set, not looking at your model, and not comparing your model to a simple baseline model.
Common Machine Learning mistake #3: Developing to the test set
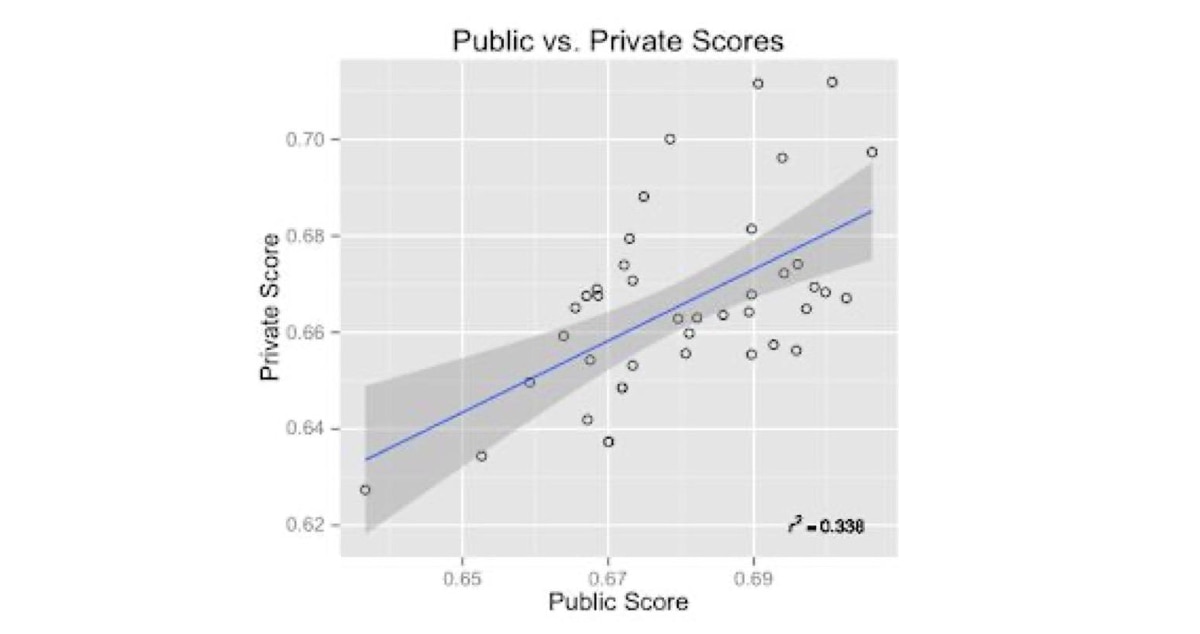
If you try to drive up performance on a single test set (Kaggle “Public”), you may fool yourself into thinking your results are better than they actually are on a new blind set (Kaggle “Private”). In the two charts below from The dangers of overfitting: a Kaggle postmortem, you can see that the competitors who submitted many times were able to obtain a low rank (better performance) on the Public leaderboard. But those same competitors obtained a much higher rank (lower performance) on the Private leaderboard, after evaluating on new blind data. Competitors who submitted a moderate number of times (around 10) were able to achieve the lowest rank on the Private leaderboard
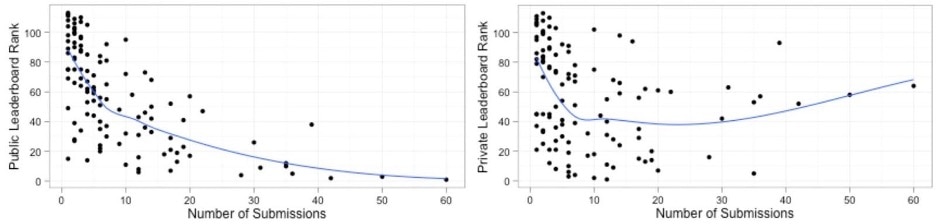
The dangers of overfitting: a Kaggle postmortem Source: http://gregpark.io/blog/Kaggle-Psychopathy-Postmortem/
You should keep in mind that your results on your test set (Kaggle “Public”) may differ considerably from your results on a blind set (Kaggle “Private”) such as in the example below.
Five Lessons from Kaggle's Event Recommendation Engine Challenge. Source: http://www.rouli.net/2013/02/five-lessons-from-kaggles-event.html
Solution - How to avoid developing to the test set
- Make sure you have enough data. Set aside multiple test sets at the beginning. Set aside several blind sets at the beginning for final evaluation.
- Avoid using a test set too many times. Each time you look at your results on the test set, you gain knowledge about it that may leak into the model.
- Periodically roll out new test sets. Reusing a test set too many times can lead to overfitting.
- Recognize that results on a test set are preliminary. They may not reflect what will happen in production.
- Use the latest hyperparameter optimization methods.
- For the true test, test in production! Use A/B testing or related methods.
Common Machine Learning mistake #4: Not looking at the model
Do you know what your model is doing? You might not if you don’t look at it.
Attention heatmaps and other neural network visualization techniques help you understand model performance. Here in the example below, model (b) performs better because it better attends to the important parts of a review than model (a).

A Structured Self-attentive Sentence Embedding Source: https://arxiv.org/abs/1703.03130
Solution - How to look at your model
- Consider using visualization techniques like heatmaps, highlighting, clustering, t-distributed stochastic neighbor embedding (t-SNE), uniform manifold approximation and projection (UMAP), and the embedding projector.
- For regression models, look at the weights.
- For decision trees, look at the splits.
- For neural networks, use neural network visualization techniques, like activation atlas, feature visualization, and the grand tour.
- Use explainable AI tools. For example, lines whose darkness corresponds to attention weights can help you understand Transformer models. Here, we can see that BERT correctly associates verbs with their direct objects:

Emergent linguistic structure in artificial neural networks trained by self-supervision Source: https://doi.org/10.1073/pnas.1907367117
- Perform failure analysis. Look at the cases where the model fails.
- Run the model interactively. Try new inputs and look at the outputs. Try unusual inputs. Try to break the model.
- Evaluate your model using a variety of metrics. Look at metrics for subsets of the data (for example, at the intent level).
- Investigate why certain features help or don’t help. This may lead you to discover further problems.
Common Machine Learning mistake #5: Not comparing to a simple baseline model
It’s natural to want to start with a complex model. But sometimes a single neuron (otherwise known as logistic regression) performs as well as a deep neural network with six hidden layers. In the figure below from Neural Network Applications in Earthquake Prediction (1994-2019): Meta-Analytic Insight on their Limitations, we see four neural networks used to predict earthquake aftershock locations. The performance of the network with six hidden layers (DeVries 18 DNN) was matched by the smaller networks (simplified DNN, ANN, and logistic regression).

Deep learning of aftershock patterns following large earthquakes Sources: https://www.nature.com/articles/s41586-018-0438-y https://www.nature.com/articles/s41586-019-1582-8 and https://arxiv.org/abs/1910.01178
Solution - How to compare to a simple baseline model
- Don’t start with a complex model. Try a simple baseline model first. For classification problems, calculate the majority class baseline. Then try more complex models.
- Perform ablation studies to determine the contribution of each part of your architecture and what parts of the architecture are actually needed.
Process issues in Machine Learning
Finally, there are several issues that are less technical and more related to the process you follow. There are five process issues: not qualifying the use case, not understanding the user, developing technology for technology’s sake, not using existing solutions, and not performing failure analysis.
Common Machine Learning mistake #6: Not qualifying the use case
Before starting a machine learning project, it’s important to determine whether the project is worth doing and to consider its ramifications.
In this example from 2014, a $100 million project to gather and analyze data on student performance was shut down. The project was intended to help educators improve student learning. Unfortunately, it was shut down because of concerns from the public about potential data misuse.

inBloom to Shut Down Amid Growing Data-Privacy Concerns Source: https://bits.blogs.nytimes.com/2014/04/21/inbloom-student-data-repository-to-close/ https://www.edweek.org/technology/inbloom-to-shut-down-amid-growing-data-privacy-concerns/2014/04
Solution - How to qualify a Machine Learning use case
At the start of a project, make sure you qualify the use case by addressing a number of questions.
- What’s the problem? Is the problem clearly defined?
- How frequently does the problem occur?
- What’s the proposed solution? Why is it expected to succeed?
- What work has previously been performed on the problem?
- Is there a clear success metric? Can the success metric be evaluated automatically or does it require human annotation?
- Do you have any preliminary results, such as from a proof of concept (POC) model? How do they look?
- Is the necessary data available? You’ll typically need historical data to train the model and realtime data to run the model in production.
- What’s the cost to source and/or create the data?
- What are the project’s risks? Consider issues of data privacy, bias and fairness, transparency, and user acceptance.
- What’s the economic benefit of the project?
- What are the upfront and maintenance costs of the project?
- What’s the minimum viable product (MVP)?
- Imagine it works. Then what?
Common Machine Learning mistake #7: Not understanding the user
What does your user (customer and/or business) really need and want?
Here’s an example of a system that wasn’t as successful with users as initially hoped. After the deployment of drug-drug interaction alerting systems in the late 1990s, only 44% of Veterans Affairs prescribers were satisfied with their accuracy. 13% even called the alerts “a waste of time.” On the other hand, alerting systems are helpful for detecting and preventing significant problems, whether or not they are annoying to users.
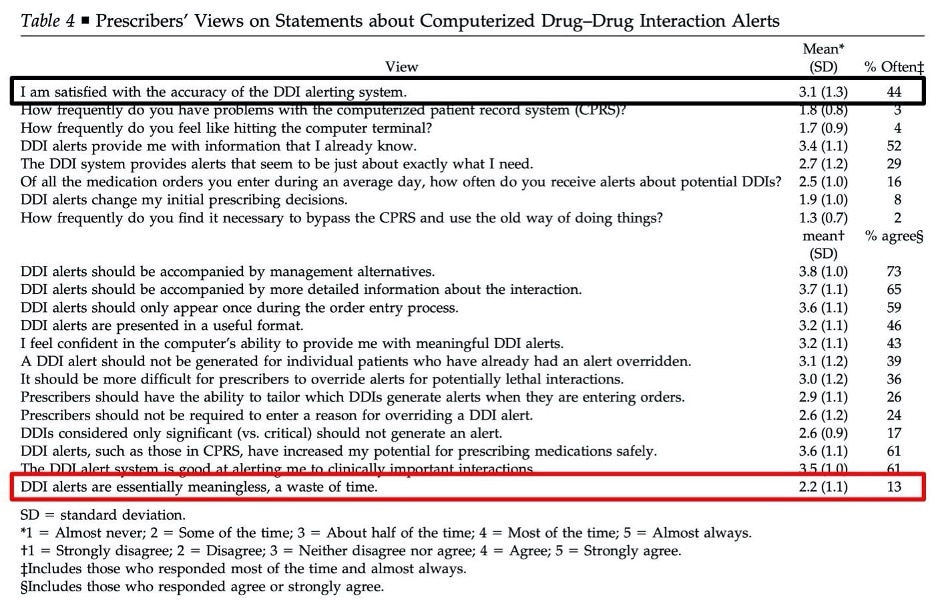
Practitioners’ Views on Computerized Drug–Drug Interaction Alerts in the VA System. Source: https://www.ncbi.nlm.nih.gov/pmc/articles/PMC2215077/
Here’s another example, also from health care, in which providers overrode medication-related clinical decision support (CDS) alerts about 50% of the time:

Overrides of medication-related clinical decision support alerts in outpatients. Source: https://www.ncbi.nlm.nih.gov/pmc/articles/PMC3994856/
Solution - How to understand the user
You can improve your system by studying how users work and what they need and want. This is as true in machine learning as it is for traditional software.
In health care, early medical decision support systems, which were developed starting in the 1970s, failed to achieve adoption, largely because the systems weren’t well integrated into the workflow of clinicians. By listening closely to clinicians, developers have improved these systems. In this example from 2016, the SimulConsult system generates charts showing how a disease’s signs, symptoms, and findings unfold over time, in contrast to traditional diagnosis systems, which simply provide lists of diagnoses.
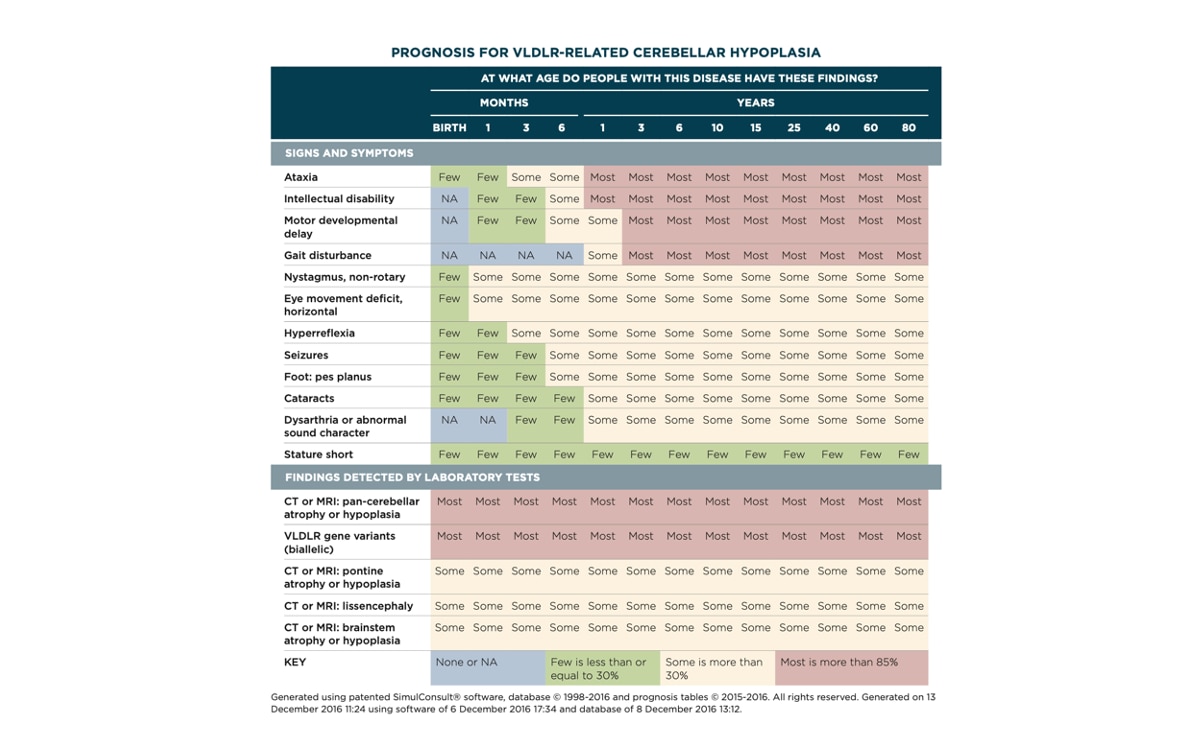
Experience with Integrating Diagnostic Decision Support Software with Electronic Health Records: Benefits versus Risks of Information Sharing Source: https://www.ncbi.nlm.nih.gov/pmc/articles/PMC5994959/
- Solve real problems for users.
- Involve users in the development process.
- Ask users lots of questions. Is this helpful to you? Do you want it? Where might it fail? What would be most helpful? Is there something else that would be more helpful?
- Talk to users about the POC or product.
- Use user-centered design techniques such as interviews, focus groups, surveys, naturalistic observation, contextual inquiry, shadowing, role-playing, Wizard of Oz experiments, and usability testing.
- Be prepared to iterate.
- When developing a system, consider all facets of the user experience such as whether the system is useful, usable, desirable, valuable, findable, accessible, and credible.
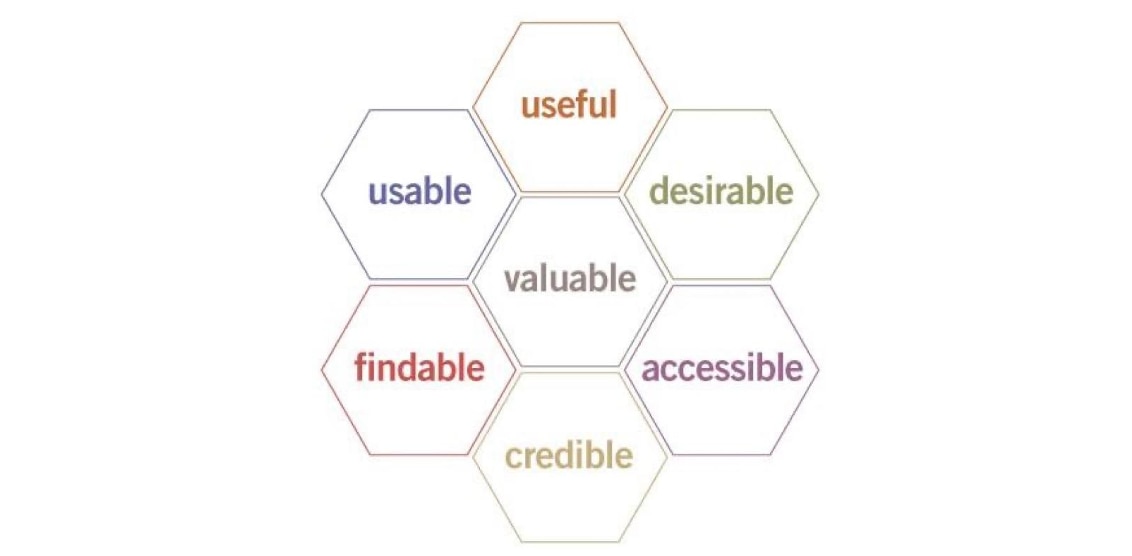
User Experience Design. Source: http://semanticstudios.com/user_experience_design/
Common Machine Learning mistake #8: Developing technology for technology’s sake
Are you developing technology for technology’s sake? In 2016, MIT’s Kalyan Veeramachaneni described how machine learning experts often fail to address the business value of their work.
At a recent panel filled with machine learning enthusiasts, I polled the audience of about 150 people, asking “How many of you have built a machine learning model?” Roughly one-third raised their hands. Next, I asked, “How many of you have deployed and/or used this model to generate value, and evaluated it?” No one had their hand up.
Why You’re Not Getting Value from Your Data Science Source: https://hbr.org/2016/12/why-youre-not-getting-value-from-your-data-science
Solution - How to avoid developing technology for technology’s sake
- Estimate the business relevance at the beginning of the project.
- Communicate and collaborate frequently with stakeholders.
- Estimate revenues, benefits to customer satisfaction, and costs. Is the project worth doing? Don’t develop something just because it’s cool. Well, maybe do if you’re really sure about it!
Common Machine Learning mistake #9: Not using existing solutions
Are you aware of all the machine learning solutions that are out there? It’s worth exploring at least the offerings of the major technology companies, such as Google’s AI platform, the AWS machine learning services, Facebook’s AI tools, Microsoft’s AI platform, and Apple’s machine learning offerings. For automating the application of machine learning (AutoML), there are many tools to choose from, such as those listed in the Capital One study Towards Automated Machine Learning: Evaluation and Comparison of AutoML Approaches and Tools.
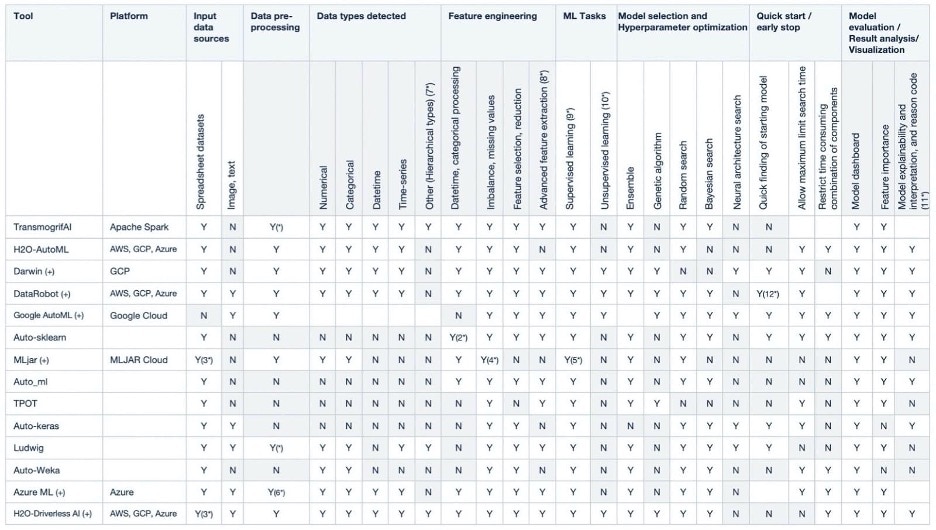
Towards Automated Machine Learning: Evaluation and Comparison of AutoML Approaches and Tools Source: https://arxiv.org/abs/1908.05557
Solution - How to find and use existing solutions
- Stay aware of what’s out there.
- Search for past work.
- Search for academic papers using Google Scholar and Semantic Scholar.
- Ask people.
- Do a fresh search regularly. The state of the art is constantly changing. Many research papers are published to the arXiv.org e-print archive, and you can subscribe to the arXiv email alerting service.
- Make a deliberate build vs. buy decision. Your system may be a combination of existing and new solutions.
Common Machine Learning mistake #10: Not performing failure analysis
If you don’t perform a failure analysis—an analysis of the frequency of different categories of failure of your system—you may be expending a lot of effort for little result.
Look at this pie chart from Towards a Quantitative, Platform-Independent Analysis of Knowledge Systems, which shows the results of a failure analysis performed on Cycorp’s system for answering chemistry questions. The analysis was performed on a 100-question chemistry exam whose maximum possible score was 1008. The most significant source of failure of the system was lack of chemistry knowledge (B-MOD-1), resulting in a loss of 408.5 points on the exam. This indicates that increasing the system’s chemistry knowledge should be prioritized. In contrast, limitations of the knowledge representation language (B-MOD-3) resulted in a loss of only 20 points. (The colors for B-MOD-1 and OTHER are incorrectly swapped in the chart.)
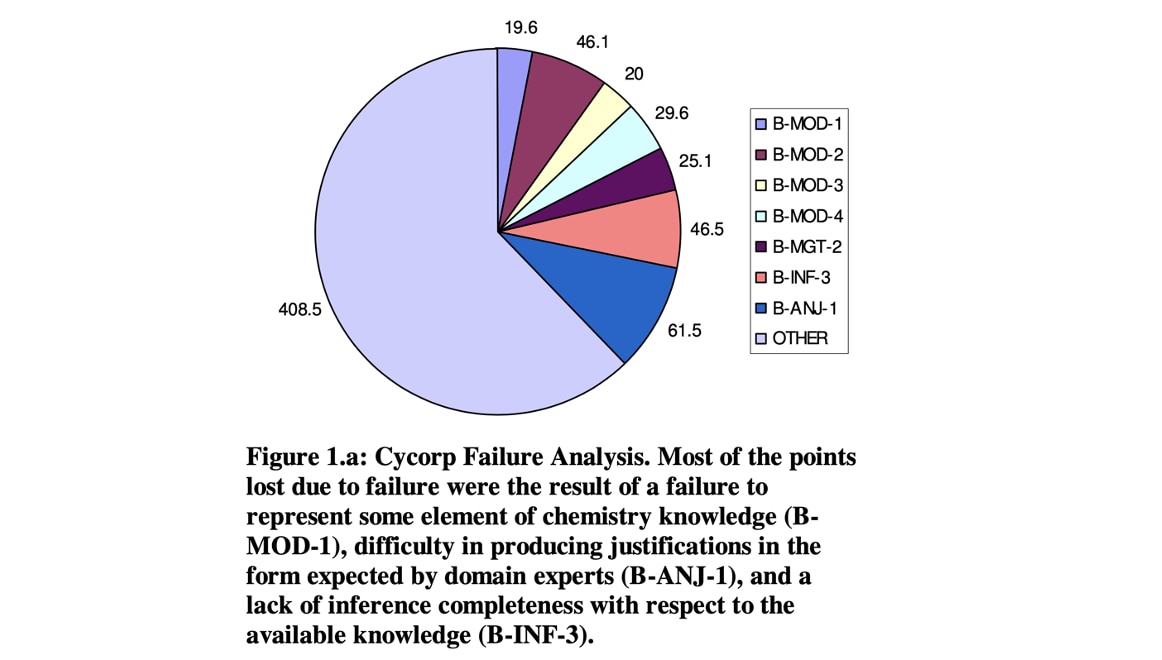
Towards a Quantitative, Platform-Independent Analysis of Knowledge Systems. Source: https://www.aaai.org/Papers/KR/2004/KR04-053.pdf
Solution - How to perform failure analysis and maximize improvement
- Analyze failures. Classify failures into problem categories and calculate the frequency of each problem category.
- For each problem category, estimate the improvement on system-level metrics if you were to succeed at solving the category.
- For each problem category, estimate the level of effort for solving the category
- Address the low hanging fruit first.
- Maximize improvement and minimize level of effort.
- In general, before working on a problem, estimate how frequently it occurs.
- Don’t solve an infrequent problem except when necessary for reasons of regulation, policy, or risk, or when you’ve already solved all the frequent problems and are now in the long tail.
A process for Machine Learning
In closing, here’s a summary process for machine learning that incorporates many of these points.
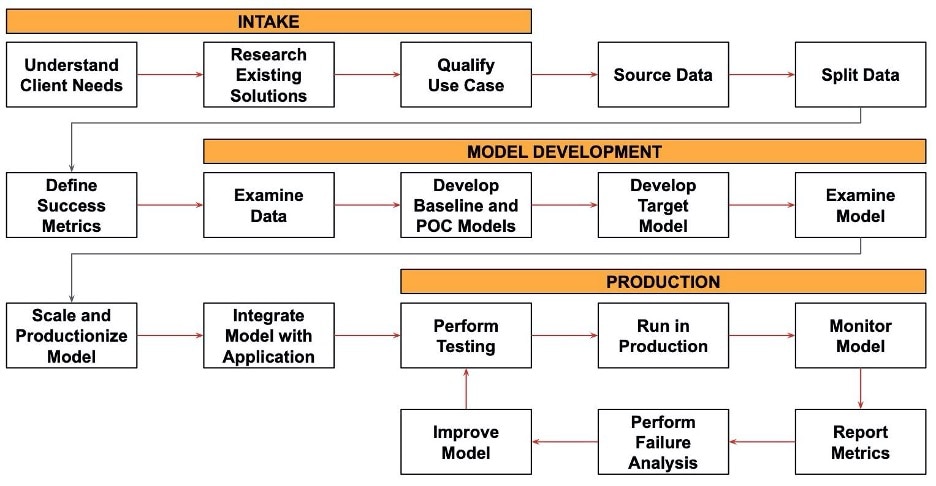
We start with the intake process. We talk with the client and understand their needs. We look into existing work on the use case and any previous solutions. We go through the process of qualifying the use case, to make sure the machine learning project is worth doing and will achieve the benefits the client thinks it will achieve.
We source and split the data, and we define success metrics.
Then we proceed with model development. We look at the data and develop baseline and POC models. Once we have those, we proceed to the development of the target model. Once we have one or more trained target models, we examine them carefully for problems.
We select a model, optimize and scale it for production use, and integrate it into the application.
Finally, we reach the production phase. We unit test the model, and we test the end-to-end application using the model. We deploy and run the model in production. We monitor the performance of the model and report success metrics to developers and the business. Periodically, we perform a failure analysis to identify opportunities for improvement. We improve the model and deploy the new version into production, and the improvement cycle repeats.