Here's why you don't necessarily need data for data science

“Synthetic data.” It’s a term you may have heard of before, but if you haven’t, it is essentially fake data that contains the same schema and statistical properties as its “real” counterpart. In other words, it looks so real that it’s nearly impossible to tell that it’s not.
So what’s the point of synthetic data, and why does it matter if we already have access to the real thing?
During software development, data engineering, data science, or machine learning tasks, we often need access to real data to develop systems. Unfortunately, we live in a world of data leaks and privacy concerns, which can dramatically impact organizations, individuals, and society at large; this makes the use of synthetic data a more secure approach to development in certain instances.
Further, for companies that operate in a highly-regulated industry — and with the advent of new regulations and guidelines the world over, such as the EU’s General Data Protection Regulation (GDPR) — the use of synthetic data can prove effective in remaining compliant, protecting sensitive data, and retaining flexibility to continue developing and innovating.
With that in mind, I want to delve into three core instances that can serve as ideal use cases for the application of synthetic data:
- Software Development
- Data Engineering
- Data Science
In these instances, one of the primary drivers in utilizing synthetic data is to make it easier to develop while improving security.
Generating Synthetic Data
With simplicity and security of data access in mind, my team at Capital One’s lab in the University of Illinois Urbana-Champaign’s research park, developed a Python library to assist in the data generation process. For the purposes of this post, we’ll call it the SyntheticDataGenerator* class.
It takes just a few lines of code to ingest a real data sample and create a safely shareable model that generates synthetic data:

The library itself can generate synthetic data for structured data formats (CSV, TSV), semi-structured data formats (JSON, Parquet, Avro), and unstructured data formats (raw text).
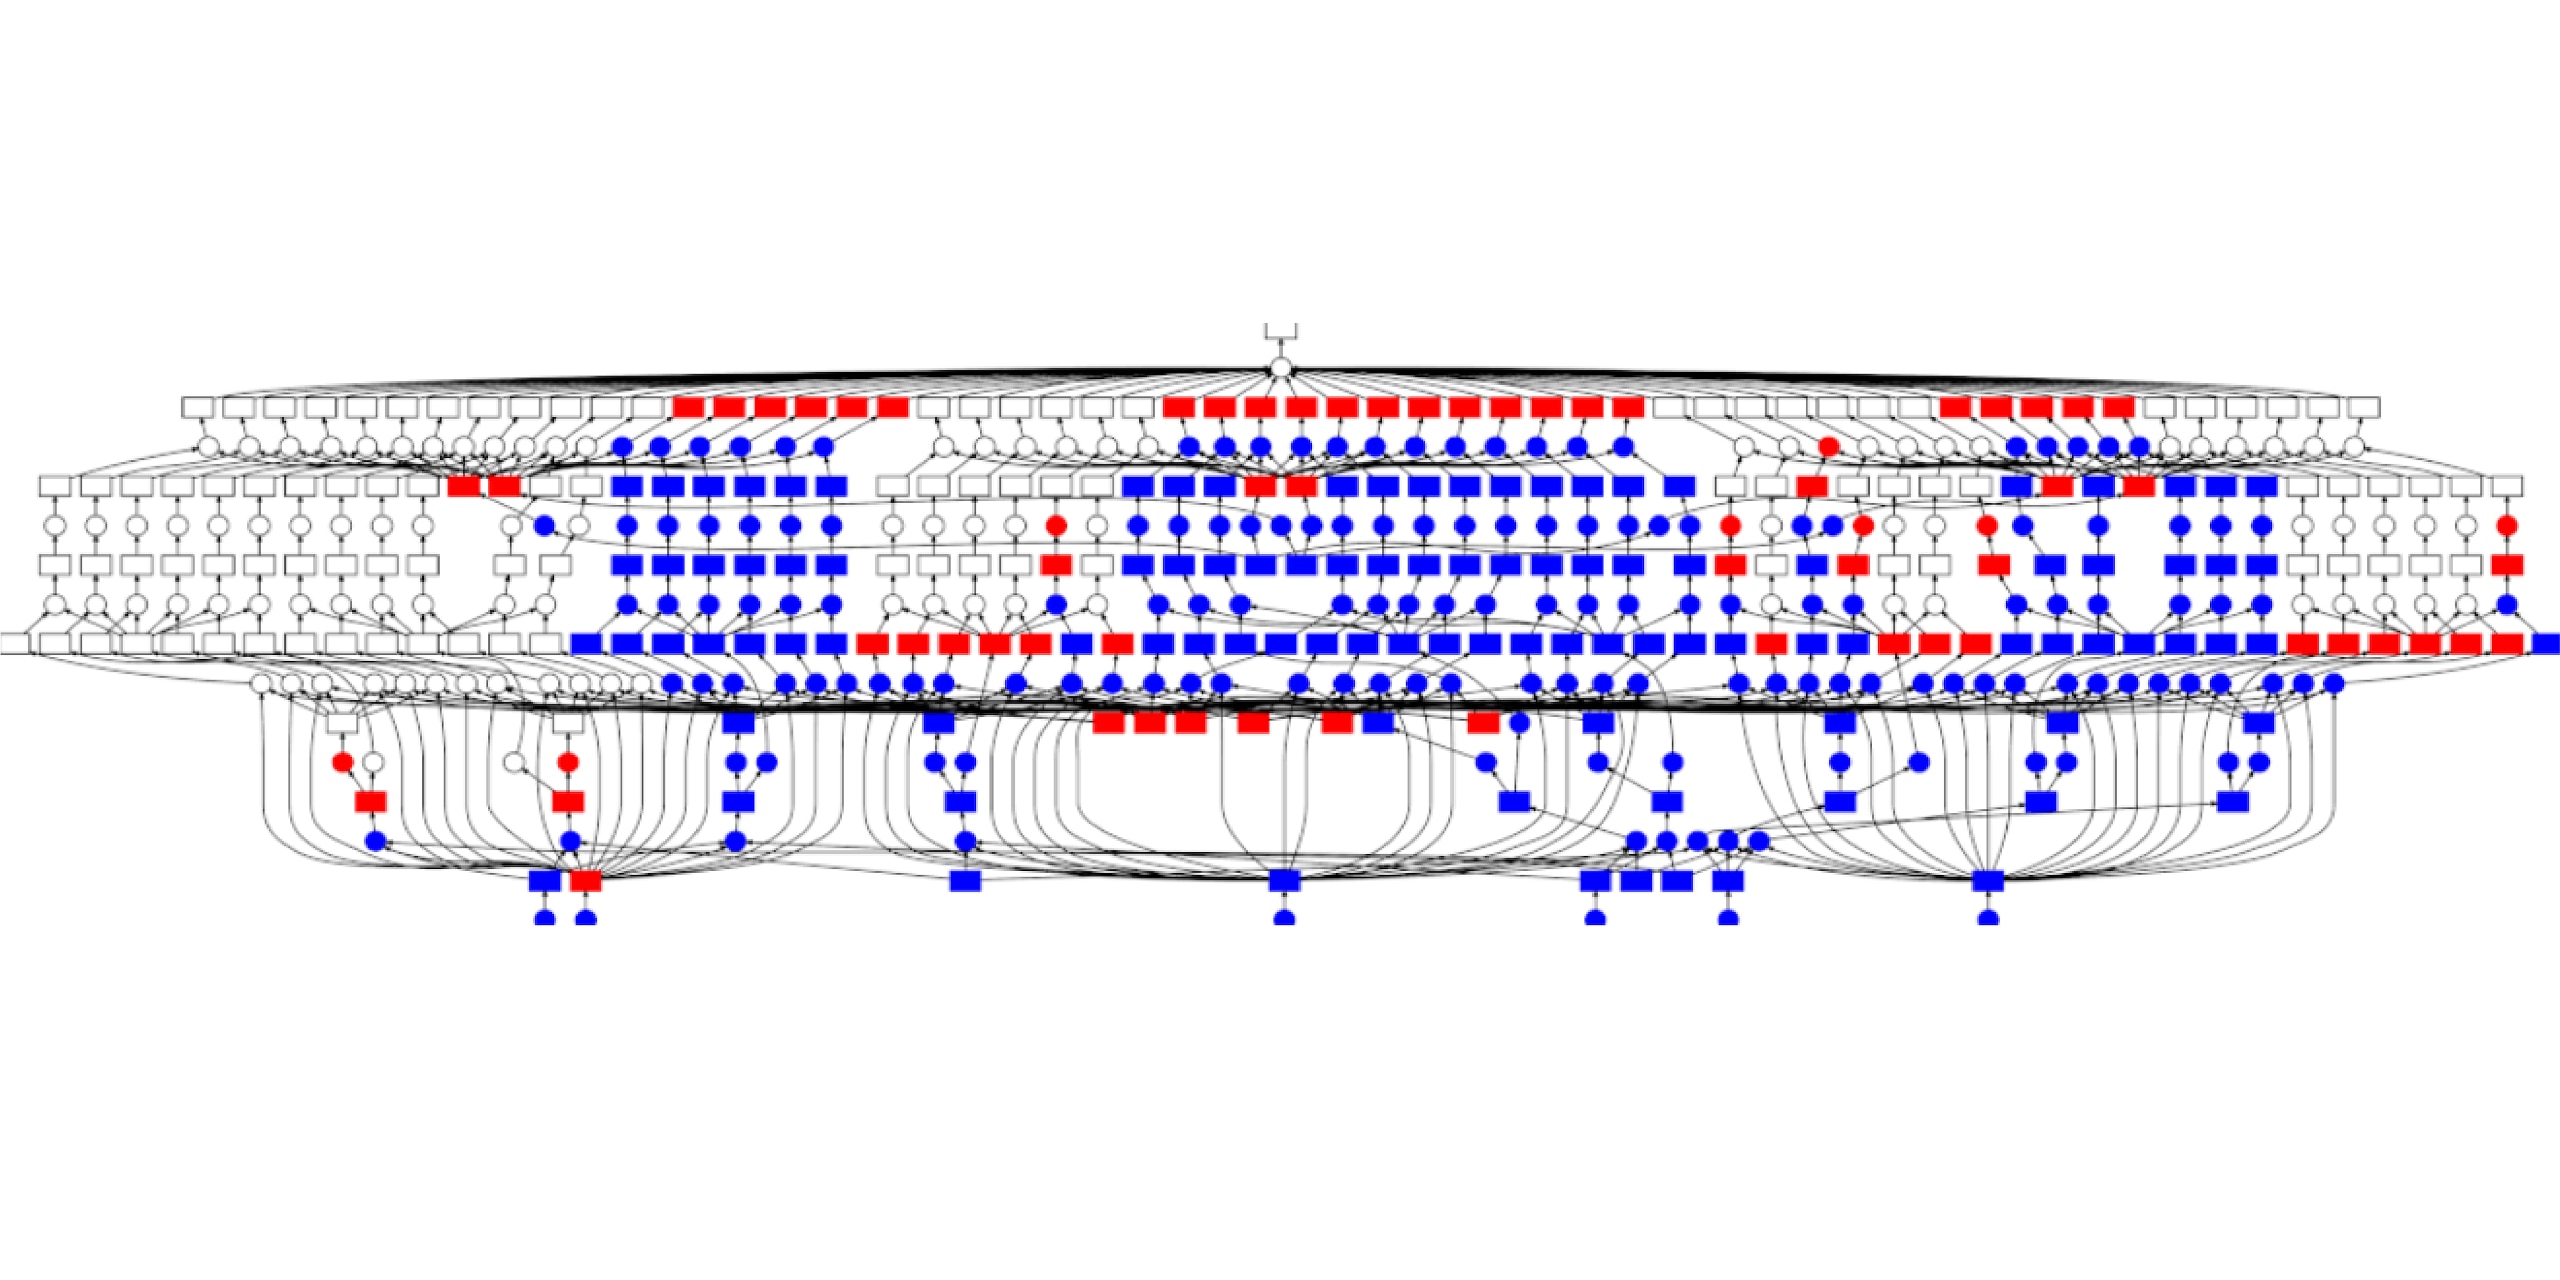
Each data format requires its own machine learning model(s). For structured data, where relationships between columns need to be maintained, we primarily use Generative Adversarial Networks (GANs). For semi-structured and unstructured data formats, we would typically use Recurrent Neural Networks (RNNs).
Synthetic Structured Data
Structured data (where we use GANs) is often used by data scientists to develop machine learning and statistical models. For this use case, we would need to keep the synthetic data’s schema, data distribution, and relationship between columns as close to real as possible.
The first example we’ll look at is utilizing SyntheticDataGenerator on adiamond dataset:
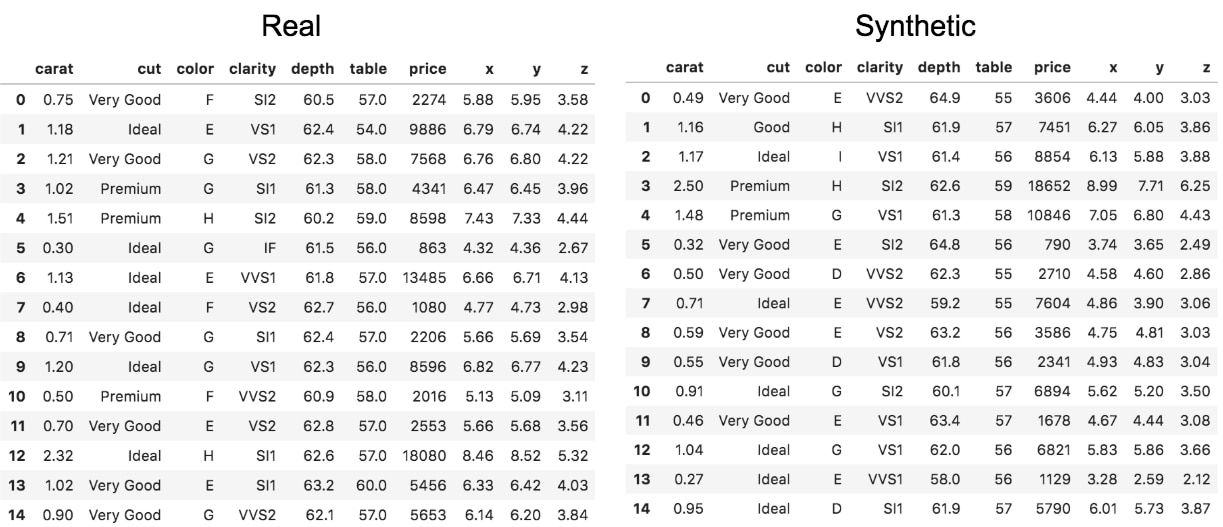
Based on the schema and the sample it’s difficult to discern a difference.
If we go further and start looking at the statistical properties of synthetic vs. real data, you’ll start to notice a difference; however, it will often be slight. Take for instance the distribution of the cut of the diamond; they look very similar:
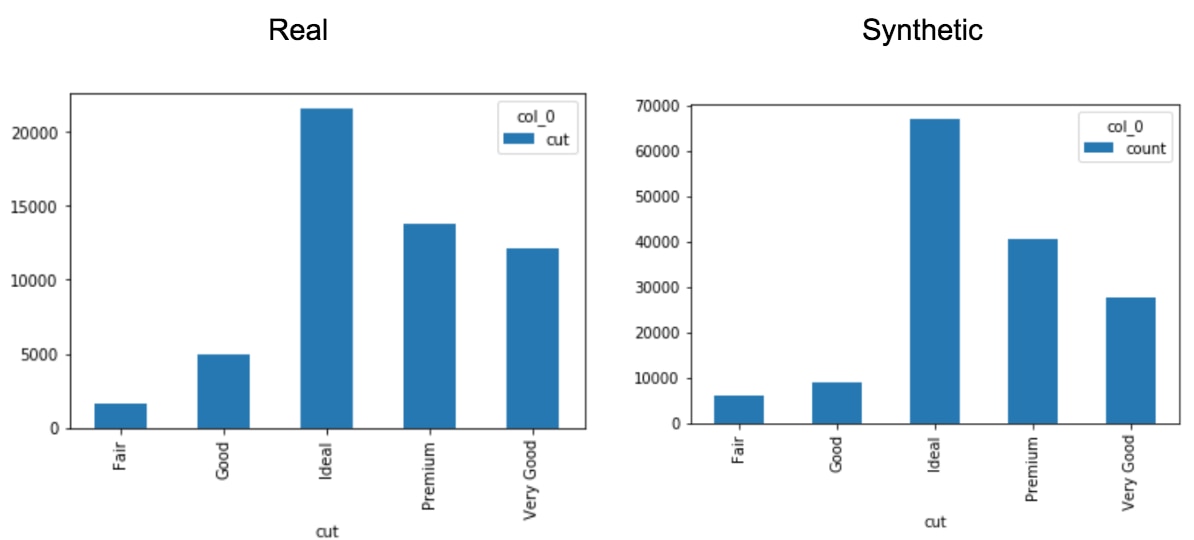
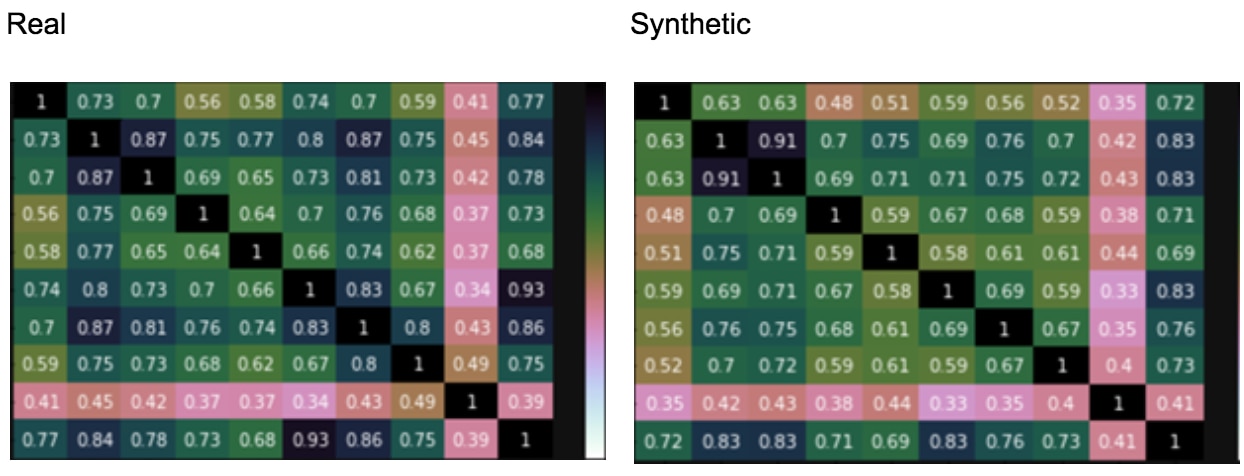
Often, the real and synthetic data sets have minor differences between the data distribution(s), often within a few percent of the original data distribution(s). Perhaps more importantly, the relationship between the various data distributions, made clear by the covariance matrix, is also kept roughly the same.
Below is an example from the Wisconsin Cancer Dataset, which can be used for a sample classification problem (such as identifying a malignant or benign tumor):
In this case, because the covariance matrix, data distributions and other aspects of the data are so similar, the classification model we trained actually does about as well as training on the synthetic data as the real data.
It’s important to note that training a model on synthetic data does not always work as well on real data. When generating synthetic data there is always a decrease in data resolution — which means it’s never quite as good as the original. However, in general, synthetic data does enable the initial development of a model, which when retrained on real data (especially when transfer learning is applied), will often perform as expected.
Synthetic Semi-Structured Data
Beyond model development, there are also key use cases in software development and data engineering where semi-structured and unstructured data is more common. For semi-structured and unstructured data formats, we use RNNs, which will actually learn to generate not only data but schema as well.
Take for instance proxy logs. Below, we have the real logs (unstructured data):
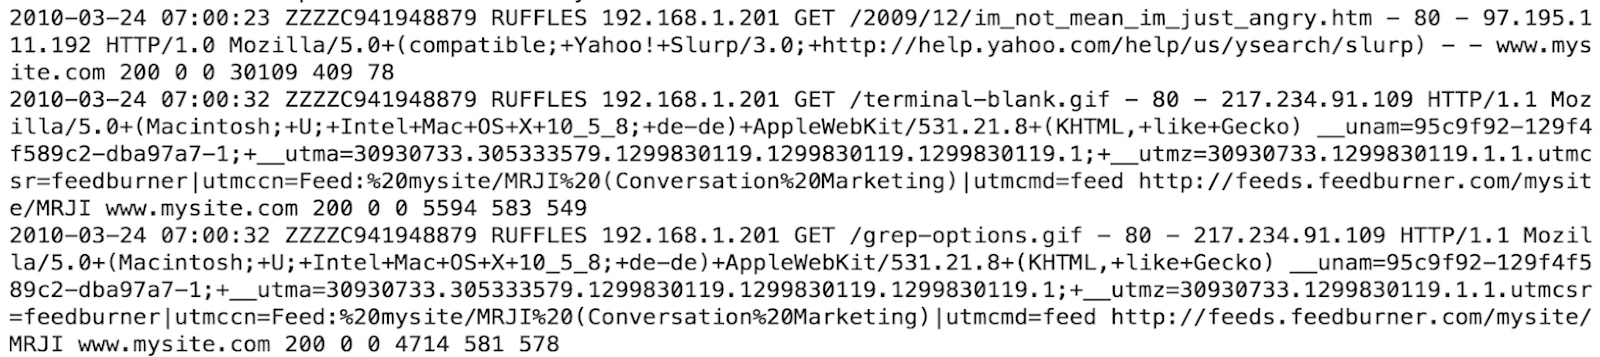
If you compare these against a synthetic log, they look almost identical:

It would be very hard, if not impossible, to tell the difference. By default, our system checks multiple metrics and overlap of output vs. real data among other variables. In testing, our parsers can function on both synthetic and real data alike.
In the semi-structured case, such as JSON objects, the RNN will learn the structure of the JSON object. This will even include distribution of keys, slight variations in the schema, or nested JSON objects such as { “json”: { “embedded json”: “value” }.
The example below demonstrates such a case:

The use case for this kind of data is primarily building parsers, data pipelines, and responding to API requests. One particular way this could be used is in constructing a load testing system; it enables teams to identify how much data the system can handle and whether it autoscales, among other key insights.
Synthetic Tokenized Data
One additional point to touch on is tokenization, or replacing portions of data that need to be made secure with a token. This maintains the real relationships within the data — for instance, any ID that appears in a row of data would contain the exact same token, enabling each of the rows to stay linked.
With synthetic data, this tokenization process is improved — we call it “smart tokenizing” — enabling the replacement of secure fields with synthetic tokens that look just like the original! This means that practitioners can continue to do everything from data science to software engineering with absolutely no hindrance by the fact that the data isn’t real.
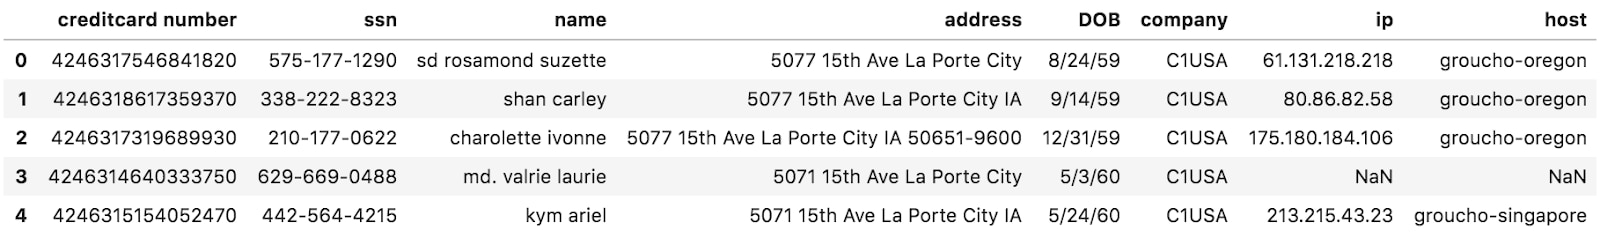
Take the example below, where we tokenized the address, SSN, and credit card fields of an example purchasing dataset (note: dataset was created from combining this publicly available Kaggle dataset, with randomly generated fake SSNs, credit cards, addresses, and names):
Original Dataset
Synthetically Tokenized Dataset
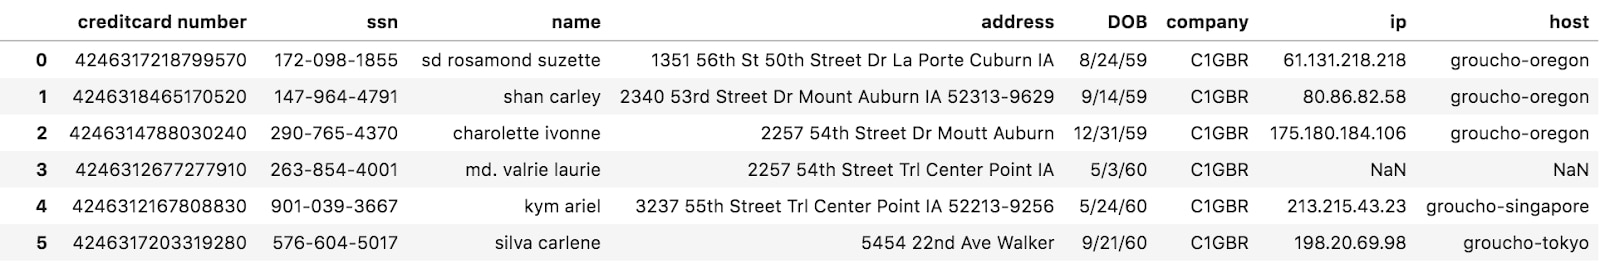
When we tokenize, we ensure none of the new values exactly map to the original data, ensuring there is no way to reverse the exact fields (in this case “credit card number”, “ssn” and “address” fields).
The Benefits of Synthetic Data
The use of synthetic data brings myriad benefits, not least of all the ability to ensure stricter security for sensitive datasets.
For engineers, analysts, and data scientist in particular, it means we can now do our jobs better and more securely. Within a few moments, we can typically find a dataset, download the synthetic data generation model, and start development, only requesting access to real data when and if necessary.
For us at Capital One, this means we can develop faster and more securely, thanks to synthetic data.
SyntheticDataGenerator library was developed by the Data Innovation team at Capital One’s University of Illinois, Urbana-Champaign lab. Primarily by Anh Truong, Fardin Abdi, Vincent Pham, Mark Watson, Jeremy Goodsitt and Austin Walters.