A Practical Guide to Tackling Alert Fatigue
How the right alerts can fight alert fatigue and help you sleep better at night!

While striving to deliver the most superior uninterrupted experience to customers, companies are introducing diverse ways to monitor their applications. Alerting represents a convenient and effective way to monitor any application or service. It avoids the strenuous effort of tracking all critical application metrics manually, and is popular within tech, as well as many other industries.
If not done right, however, this can result in alert fatigue. Alert fatigue can ultimately beat the purpose of monitoring applications, so understanding what alert fatigue is, and how to grapple with it, is an important part of application monitoring. Imagine what happens when there are so many alerts you are no longer paying attention to them? Imagine a physician who ignores an alert that indicates a negative drug interaction on some medications administered to a hospital patient. Or imagine a fraud analyst who ignores an alert that indicates significant losses to the company and its customers.
Ignoring critical alerts can result in significant damage, which is sometimes irreversible.
In software engineering, alert fatigue is frequently cited as a reason why critical alerts that point to customer impacting issues are ignored or missed by on-call resources. In this blog post we will go over the fundamental concept of alert fatigue. We will also look at a few simple steps for building intelligent monitoring strategies on software applications that help in effectively addressing the problem.
What is alert fatigue?
Alert fatigue, also known as alarm fatigue, is when an overwhelming amount of alerts desensitizes the people tasked with responding to them, leading to missed or ignored alerts or delayed responses.
What causes alert fatigue?
Alert fatigue can be caused by any of the following:
- Low risk alerts are exceeding high risk alerts.
- Ignored alerts are exceeding actionable alerts.
- There is a lack of clarity around triggered alerts.
- There is no correlation between triggered alerts.
What is the impact of alert fatigue?
The impact of alert fatigue can vary from person to person, but a few common experiences with it are:
- Increase in MTTA (mean time to acknowledge) and MTTR (mean time to respond).
- Missing critical issues that have customer impact.
- Wasted time and labor.
- Physical and emotional stress.
3 steps to tackle alert fatigue
Not every bump or blip on the screen should be alerted as an issue. It is recommended to create alerts only for issues where an action needs to be taken immediately. Less is truly more when you think about alerts. Below are three steps that can help in effectively addressing alert fatigue.
Step 1 - Choose SLIs
Strategically choose metrics or Service Level Indicators (SLIs) that are critical to maintain Service Level Agreements (SLAs) or Service Level Objectives (SLOs). This is one of the most critical steps and needs to be well thought through.
Note: SLA is an agreement between the service provider and customer about service deliverables. SLOs specify a target level for the reliability of your service. SLIs are measurements of the characteristics of a service. SLI’s directly gauge those behaviours that have the greatest impact on the customer experience.
Step 2 - Create intelligent alerts
Create alerts on chosen metrics by following the below alerting strategies:
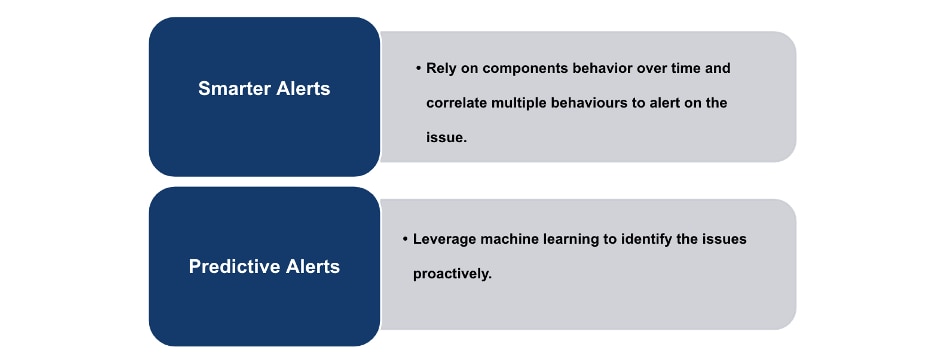
Smarter alerts
Here are few ways of implementing smarter alerts:
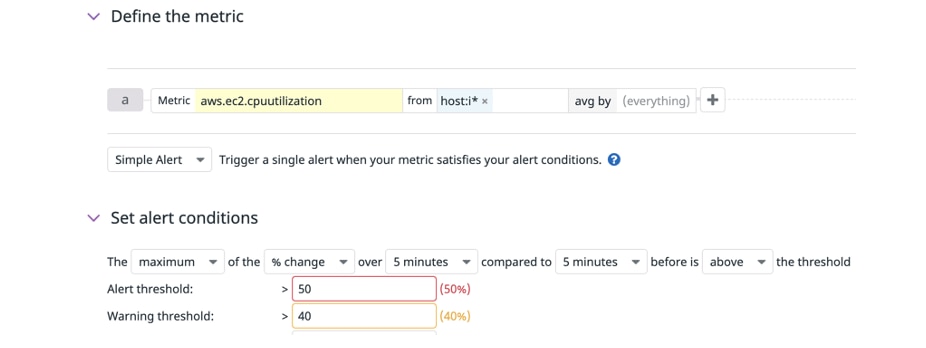
- Alerts based on rate of change over time - When monitoring dynamic systems in today’s world, alerting on a metric’s rate of change gives you more flexibility. These type of alerts provide appropriate results as the alert conditions automatically adapt to the way your system behaves. Alerts based on rate of change is one of the best alternatives for alerts based on static thresholds, as the latter tends to create a lot of alert noise.
Below is the example of rate of change alert in the Datadog monitoring tool. It triggers an alert when the percentage change on the CPU utilization metric of an EC2 instance is greater than 50% over the past five minutes.
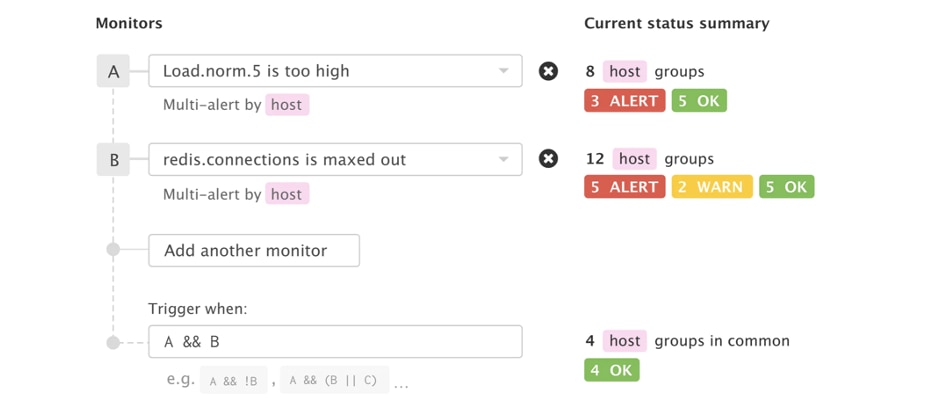
- Alerts that correlate multiple behaviours - Often, issues that require intervention are identified not by a single metric or event, but by a combination of indicators. In order to gather actionable insights without creating alert noise, it is important to correlate multiple metric behaviors that effectively signal potential issues with the system.
Here is an example of a composite monitor in Datadog that triggers only when message queue length crosses a threshold and the uptime for the service is greater than 10 minutes. This rules out false alarms related to temporary increases in message queue length during service restarts.
- Alerts based on statistical data aggregations - Alerts based on statistical data aggregations -- like percentiles, averages etc. -- on critical metrics help in tracking conformance to SLAs that a system may have with it’s customers.
Here is an example New Relic time series query to alert on the median (50th percentile) of web transactions responding with a 200 response code.
SELECT percentile(duration,50) FROM Transaction WHERE appName = 'Storefront' and httpResponseCode = '200' and transactionType = 'Web'
An alert can be configured based on the above query result, to check if it meets the desired threshold.
Predictive alerts
Shifting gears, let's look at a few ways of implementing predictive alerting that can help in proactively monitoring metric trends and patterns using machine learning algorithms.
- Alerts to detect anomalies - Anomaly detection is an algorithmic feature that identifies when a metric is behaving differently than it has in the past, taking into consideration trends, day-of-week, and time-of-day patterns. It is well-suited for metrics with strong trends and recurring patterns that are hard to monitor with threshold-based alerting.
For example, anomaly detection can help you discover when your web traffic is unusually low on a weekday, even though that same level of traffic is normal on a weekend. Or consider a metric measuring the number of logins to your steadily growing site. Because the number increases daily, any threshold would be quickly outdated, whereas anomaly detection can alert you if there is an unexpected drop potentially indicating an issue with the login system.
- Alerts to detect outliers - Outlier detection is an algorithmic feature that allows you to detect when a specific group is behaving differently compared to its peers. For example, you could detect that one web server in a pool is processing an unusual number of requests, or significantly more user login timeouts are happening in one AWS region than the others.
- Alerts to forecast behaviour - Forecasting is an algorithmic feature that allows you to predict where a metric is heading in the future. It is well-suited for metrics with strong trends or recurring patterns. For example, if your application starts logging at a faster rate, forecasts can alert you two weeks before a disk fills up, giving you adequate time to update your log rotation policy. Or, you can forecast business metrics, such as user sign-ups, to track progress against your monthly targets.
- Smart auto-baselining alerts - Smart auto-baselining represents a dynamic approach to baselining thresholds where the reference threshold for detecting anomalies changes over time. So if a metric changes its behavior, the threshold adapts automatically in the alert. Its main advantage over a static threshold is that you don't have to know the threshold up front to set up the alert. You also don't have to manually adapt multiple static thresholds for metrics whose behavior changes over time. Smart auto-baselining alerts help in reducing the alert noise significantly.
Both the smart alerting and predictive alerting strategies work effectively in tandem, but predictive alerting will provide more bang for the buck when smarter alerts are well ironed out.
Step 3 - Automate
Identify alerts with standard remediation steps that can be automated. Tag these alerts with automated runbooks for self-healing of the system on alert triggers. Self-healing systems avoid manual intervention thereby reducing MTTA (mean time to acknowledge) and MTTR (mean time to respond).
In addition to the above steps, perform regular tuning and refinement on alerts to make sure alerts are always current.
Conclusion
Alert fatigue is a serious problem that can ultimately defeat the purpose of monitoring software applications. However, by following the few simple steps mentioned above, alert fatigue can be significantly reduced, if not totally avoided. This helps ensure uninterrupted services and happy customers, as well as better sleep for our on-call resources.
Resources