How to easily set up AWS health checks using Boto3 in Python

Updated February 2, 2024
Part 2 - How to write a Python script to automate AWS health checks
When I first joined a DevOps/SRE team, I realized many simple AWS infrastructure changes took up a large chunk of our engineering team’s time. I didn’t want to spend my valuable coding time on these manual, yet essential, tasks. So, I set out on a mission to automate them. Since I wanted to build my Python scripting skills anyway.
I discovered a way to solve two problems at once - using the software development kit Boto3 to automate my simple, manual AWS tasks using Python. For the second installment in this series I cover how to use Boto3 and Python to automate AWS health checks for instances and their services and events.

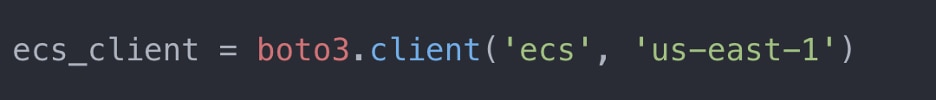
If you have already read part 1 - AWS instance tags or part 3 - AWS snapshots, then you already know how to automate instance tags and snapshots. While we created an EC2 client in the last script, we want to create one for ECS here. Using ECS is going to give us the information we need about services and events, something that EC2 does not provide.
You can then use this client to perform any of the methods listed in the ECS service section of the Boto3 documentation. The documentation is super helpful in listing all of the resources you can use, their various methods and how exactly to configure them. Feel free to explore!
![Define ECS cluster code example: clusters = ecs_client.list_clusters()[‘clusterArns’]](https://ecm.capitalone.com/WCM/tech/boto-healthchecks-2.png)
Writing a script to identify unhealthy clusters
Picture this scenario: You have lots of ECS clusters in your environments. Each cluster has multiple services, with their own events, tasks and target groups. If a cluster is unhealthy, it will begin to drain; however, it can be hard to tell which clusters are draining. In the past, I’ve found the only way to see if the services are decreasing or not being used is by constantly refreshing the AWS CLI.
To avoid doing this, you can print out detailed event messages, which can be much more helpful in troubleshooting. Let’s figure out how we can write a script that tells us which clusters are healthy, which are not and what is going wrong.
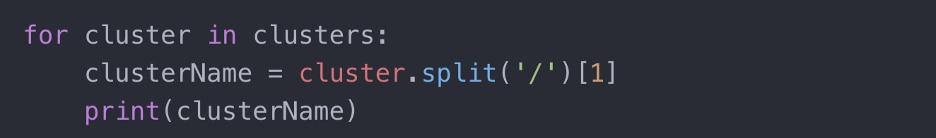
First we need to find the service cluster name
You probably noticed that the clusters this gives us start with arn:aws:ecs followed by the region and a string of integers. Because we only want the name of the cluster, not this pattern the query returns, we use the split function to get the name after the /.
There are different ways to do this, but this is what I find easiest.
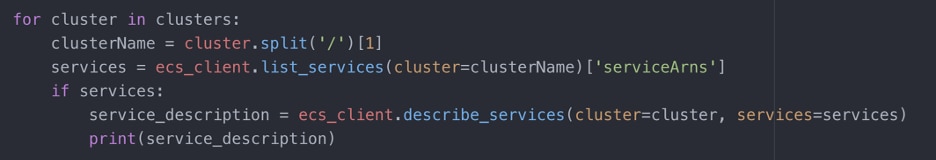
Then we use the cluster name to list our services
Look at the documentation. What method would we have to use in order to find the services for a cluster? There is really only one method that would make sense - list_services. We can see that this method needs the name of the cluster in order to find the service, which is where we will use the clusterName variable we just found.

Good! We found the services using the list_services method and found the list of names by filtering that method even further. Now, what method can we use to help us find the events of each service?
Methods to find the service events
Describe_services seems to be the only one that lists out events for each service. Typically, when scripting with Boto 3, if you use a list method, you will then want to use a describe method.

Good! We found the service description by using describe_services and specifying the cluster and services that we found earlier. We recommend deleting the image below and replacing it with the text below. Please delete the text in purple if keeping the image.

Oops! Looks like some of our services are empty. We may see an error output such as this: “An error occurred (InvalidParameterException) when calling the DescribeServices operation: Services cannot be empty.” This means we need to add a statement so that the script still runs without any errors if this is the case.
Problem fixed!
Using the service names to identify essential metrics

Now we want to use the service names we found to find important metrics like the desired count and the running count. We must loop through each service in the list of service names in order to find these metrics for each one.
This might still be hard to read. How can we make this so it’s clear to our user what is the desired count vs the running count?
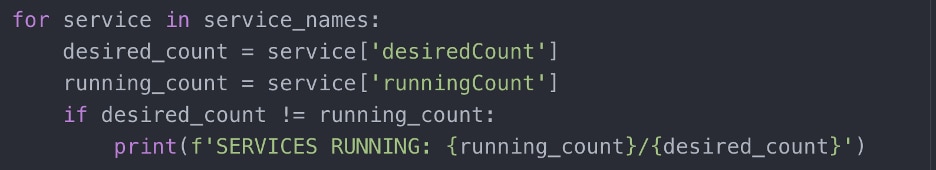
That’s better! This way we are only displaying the service counts for instances that don’t have the correct amount of services running. We are also printing how many are running out of how many are SUPPOSED TO BE running.
Reviewing task environments with event messages
Next, we want to look at event messages. They give us helpful information to tell us the current state of the services and tasks in our environment. Event messages are something that may otherwise be hard to find and read. You’d have to go through each event one by one to see its state.
We want to easily be able to see if a service in our environment has failed, and what exactly the message is.
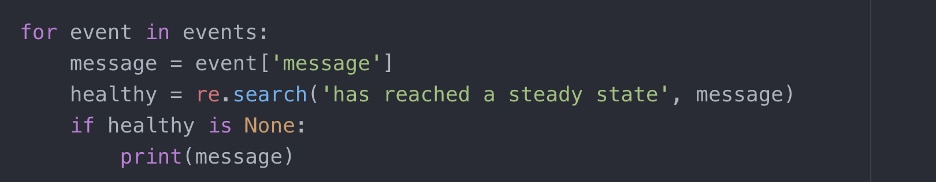
Earlier, we saw that the describe_service methods lists information about events. Now it’s time to save that information to an events variable! Let’s look at the JSON structure of the response and see how we can filter it so we only get the events.

This is going to find all the events and event information for every service.
![Find all events code example: for events in events: print(event[‘message])](https://ecm.capitalone.com/WCM/tech/boto-healthchecks-11.png)
We only really care about the event message, so let’s find that and print that for the user.
Identifying healthy services by filtering out failing messages
If we look at all of these event messages we see that every healthy service has a message of “has reached a steady state.” Since we only care about the services that are failing and DO NOT have a steady state, let’s filter these messages out.
I am using regex to search for a certain string in the event messages. If you use this, make sure you import it at the top of your script.

If the regex returns None then that means ‘has reached a steady state’ is probably in the message which, in that case, we don’t need to see. We also want to make it easier to read event messages that indicate something may have gone wrong.
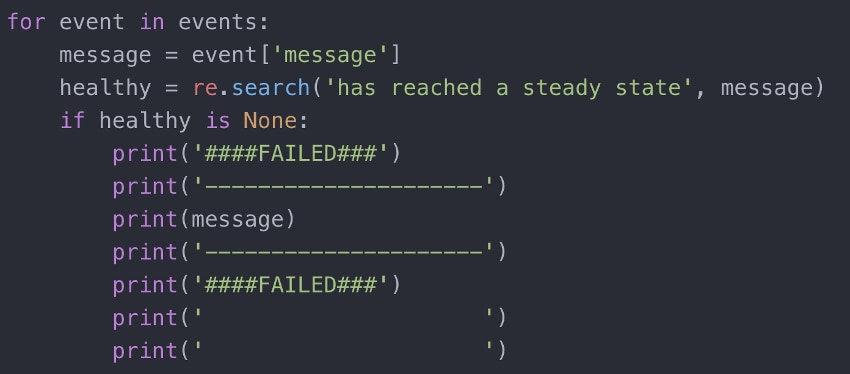
There we go! That is a lot easier to read.
Now we can easily see what may be going wrong in our environments without searching through every cluster for service and event information.
Automating AWS health checks with Python & Boto3
We've explored the process of automating AWS health checks for instances, their services and events using Boto 3 and Python. By leveraging the capabilities of AWS ECS, we've gained insights into our clusters' health, making it easier to troubleshoot and maintain their optimal performance. With a script that provides clarity on cluster health, service metrics and event messages, we've simplified the monitoring process, enhancing our AWS environment's resilience and efficiency. Stay tuned for the next installment in our series where we’ll cover automating AWS snapshots.