Automated detection, diagnosis & remediation of app failure
How machine learning enables automation of incident management at Capital One
By Arun Natarajan, Director, Software Engineering and Shekhar Damle, VP, Tech Automation
Things break. As engineers and architects we strive to build robust, resilient systems but modern applications are complex. Sometimes the unexpected happens and failure can occur. And when that happens, it’s imperative that we make fixes as quickly as possible so as to minimize the impact to customers. This is even more critical in a world where customers expect, and we provide, 24/7 banking through digital channels.
Many applications today produce massive amounts of data. Modern engineering practices and tools enable us to capture this data. “Fixing” an application that has “broken” then becomes a challenge of analyzing this data and taking action based on the results. Because of the complexity of modern applications, doing this is a difficult task and can take several subject matter experts several hours to sift through the large volumes of data to make sense of it and act on it. Machine learning offers an opportunity to do this in real time, opening up a whole new set of possibilities for how we detect, diagnose, and remediate anomalous app behavior.
The reasons behind application failure can be complex
As one of the nation’s leading digital banks, delivering a great digital experience is critical for us to maintain trust and credibility with our customers. Apps such as the Capital One Mobile App are a vital part of our millions of customers’ financial lives; if they cannot access all the app features, we can see millions of negative impacts to that trust and credibility; one for each customer account impacted.
Therefore, it is of paramount importance that when an app, such as the Capital One Mobile App, does experience anomalous behavior that we are able to restore service to our customers rapidly. Recognizing this, Capital One has invested considerable effort to improve our capabilities for managing these failures, or “incidents”, to use a technical term. We have instrumented our applications with industry leading monitoring tools, re-aligned our organization, and upskilled our talent. Our applications are now more resilient than ever before, but we are convinced that with machine learning we can do even better.
However, to do so we first needed to overcome two challenges.
-
Complex Interconnected Systems - Modern cloud based applications are designed and built as a highly interconnected system of APIs, microservices, databases, compute and storage infrastructure, and network components. Failures can occur at any node and cascade across the network. So whenever any failure occurs, multiple components may appear to be failing at the same time. The challenge is to quickly determine the source component that failed. Then engineering teams can zero-in their efforts on the actual component experiencing an issue rather than being distracted by reviewing other components that may falsely show as failing but are symptoms of the issue and not the actual issue.
-
Siloed Data - While it’s true that we have unprecedented detailed information about our applications and infrastructure in production, much of that data is produced in silos. Analyzing a failure usually requires connecting the dots across large amounts of real-time monitoring and logging data from infrastructure, applications, and APIs. If this is a manual task, you will naturally see limits to the resolution process.
Let’s look at the Capital One Mobile App to better understand the level of complexity we’re looking at in a modern application. Typically, when a customer pays their bill via the Capital One Mobile App — a seemingly routine process from the customer’s point of view — there are numerous steps involved. The process begins with login and authentication, which includes multiple layers of the stack. The payment must then pass from the mobile client through the internet service provider to the application layer, where it enters a firewall. The application infrastructure is also configured in multiple regions for resiliency purposes. Next, the request must go through another set of load balancers, through the API gateway onto the API layer. It then proceeds to the database layer, where the account is stored. From there, the customer request goes to a payment authorization database, which in this case is a third-party app.
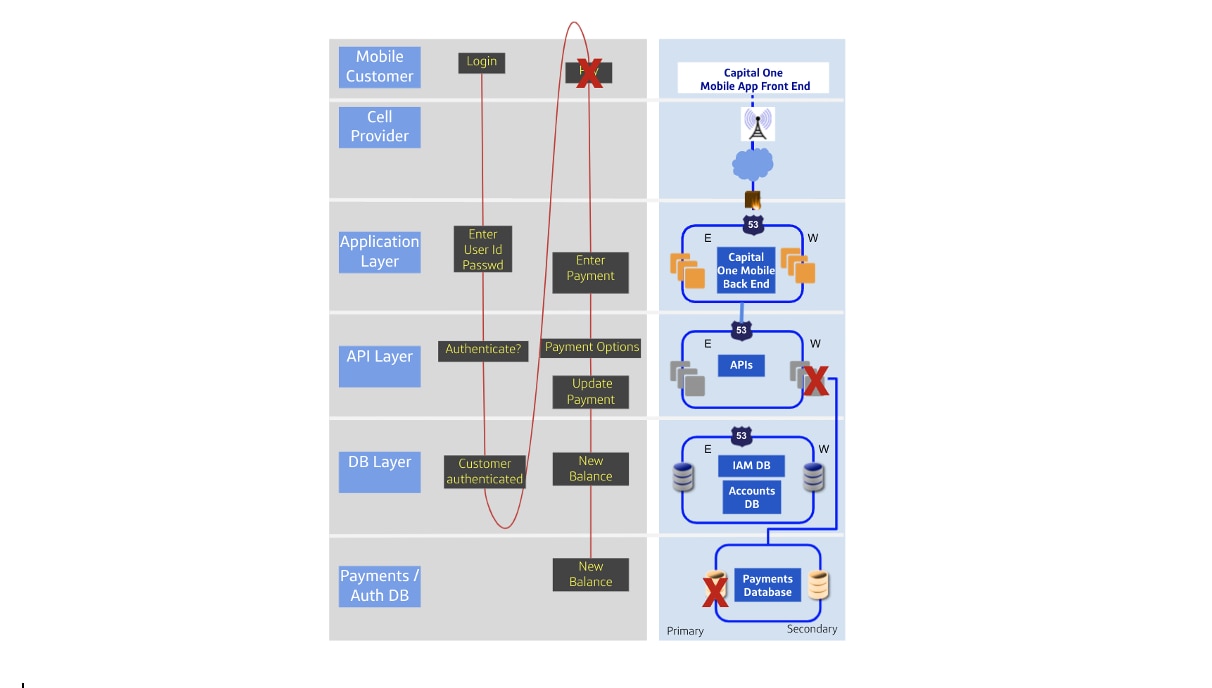
A failure with the APIs and Payments Database, as in the diagram above, could manifest as a customer’s payment failing to process. In scenarios like this, we do not want our engineers having to manually sift through several dozen components to identify which one is potentially behind the failure. Time is of the essence when apps are behaving anomalously and this workflow takes engineers a great deal of time. In addition, identifying the root issue becomes more complicated if there are multiple other services using these APIs.
It’s easy to see why manually diagnosing an application failure can be challenging.
Architecting a real-time failure detection and remediation platform
But what if we added a layer of intelligence on top of our applications, with a tool that monitors and pulls application data and determines not just that customers are unable to complete transactions, but why. And if it does so in real-time, and informs the appropriate engineers so that they can take corrective action, incidents could be resolved in a fraction of the time, avoiding extended customer impact and providing a huge lift to the customer experience.
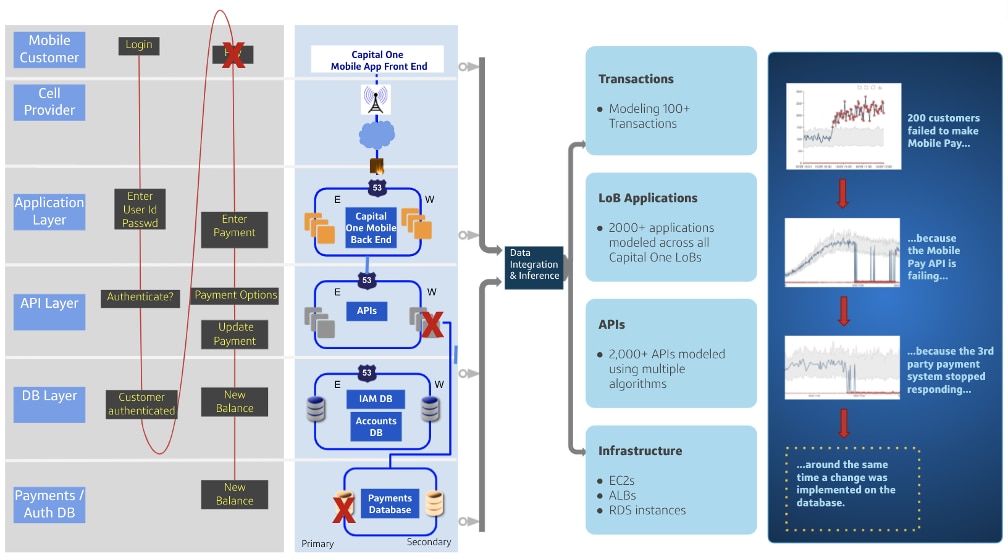
To do that we need to be able to stream in terabytes of data from multiple sources, integrate it, analyze it in real time, and present the results in an easily understandable manner. At Capital One, we are doing just that by deploying machine learning at scale on the streams of monitoring data generated by our applications.
Essentially, we built an inference engine as a layer on top of all the monitoring tools we have already deployed on our applications. This engine captures and integrates monitoring data from each component across all layers of the technology stack and ties it with the appropriate metadata. Then, using machine learning algorithms that are appropriate to the nature of the data stream, we detect anomalous patterns which are strong indicators of application failure. These anomalies are the input to a causal model that identifies which component in the complex network of connected components -- some of which are behaving anomalously and some are not -- is the most likely the source of the anomalies that we see in that network.
For example, we stream in metrics that tell us the volumes, error codes, and response times of our API calls. We built a unique algorithm to detect anomalies for each of these streams because the nature of the data in each of these streams is different and needs different types of time-series anomaly detection models. The anomaly detection models provide information about the type of failure that is occurring. We also built a dependency graph that shows the linkages across all the components of our tech stack. This, together with the anomaly data, are input into a Bayesian Network-based causal model that hones in on the component that is the most likely source of failure.

But it’s not enough to only detect anomalies and their root causes. We also had to make the tool easy for engineers to use. Otherwise, we would have ended up building just another dashboard -- as if there weren’t enough of them already! Our approach was to integrate this with the alerting tools that our engineers already used. When an anomaly is detected, an easy to understand alert is sent to the appropriate engineers based on the application components impacted. This alert contains a link to an intuitive UI that has all the info needed to address it. The UI shows which components are problematic, the metrics that are out of order, a dependency graph showing how it is linked to nearby components, and why the model thinks it’s the root cause of the failure. The end result is that this short circuits the time spent by engineers in troubleshooting incidents, all while being easy to use and already incorporated into their workflow.
Results and the road ahead
We built this tool as an accelerant for our DevOps teams, allowing them to be more dynamic and better able to make quick repairs. It also reduces dependency on those 10x engineers who seem to have a near-magical ability to detect failure sources amongst a plethora of monitoring tools and reporting dashboards. After all, if we allow ourselves to become too dependent upon a particular engineer, that means that person must always be available as a resource. Should they go on vacation, or move to a different team, then the application could be vulnerable to unidentifiable, unfixable failures. By using machine learning to automatically provide timely insights, now anytime there is a failure, our engineering teams are told clearly and directly where to look for the problem. They’re not struggling, trying to play both detective and first responder at the same time, and they’re not overly reliant on the availability and skillset of any one particularly talented teammate.
While it's still early days, results so far are promising and we believe that we can reduce the time to resolve incidents by up to 50% based on our ability to identify the true root cause of those incidents much more quickly. This means less downtime for our customers when failures do occur. There is also a huge potential for growth in the capabilities of this tool, including moving from detection to prevention of incidents, as well as from identifying failures to recommending restoration steps. In the future, as the tool is used more frequently and we collect more data, we expect to explore some of these additional ways we can speed up the restoration process and improve the experience we deliver to our customers.

