Boosting insight rates with optimization & machine learning
Increase your efficiency with a levels of intelligence framework
In the machine learning era, it’s tempting to apply complex algorithms to every user experience to maximize returns. ML is a powerful tool with wide applicability in optimization sciences. You’re waiting for the ‘but’ and I won’t disappoint. But, there is a framework that can help optimize both your outcomes and the effort applied to extract them, focusing your machine learning efforts on the most valuable problems.
As an experimentation product leader, I’ve run hundreds of experiments and machine learning-optimized campaigns over the last 15 years and am relentlessly driven to find ways of maximizing return on every optimization dollar. With the explosion of e-commerce businesses over the last decade, the arms race to the most sophisticated machine learning system to achieve advantage is a logical one, but have you considered the time and expertise to build and manage it? How do you decide where and when to deploy machine learning?
Enter the Levels of Intelligence Framework. It's a lightweight process I use in my work to help test and learn more efficiently by matching the right method to each optimization project. In this post I'll be covering experiment prioritization, an inventory of your testing methods and how to select the right mix of tools to achieve your business outcomes.
In 10 minutes you’ll have the tools to:
- Democratize experiment prioritization, ensuring a balance of diverse ideas and valuable business opportunities
- A simple, extensible equation to efficiently tackle complex experimentation designs
- A framework to match your hypotheses with the right experimental method for the job
A simple example to set up the problem
Imagine for a moment that you are building a landing page to direct your email recipients to during your big 4th quarter new product campaign. You know the window of time is small (30 days), the audience finite, and that your ability to react quickly to market signals is critical. Would you build a custom model to understand behavior, apply past segment analysis to split tests, or write rules to govern delivery of this experience?

To build your framework, first clearly understand the scope
If this landing page is well-trafficked, converts users effectively, and contains rich user data, we may use a different approach than one that is more uncertain, less valuable, and potentially has a longer timeframe to reach its potential. Ask yourself the following questions to begin building your own levels of intelligence framework:
What do I already know about the experience I’m optimizing?
- Do I have historical patterns with rich segment-based information?
- Is this similar to past experiences we’ve delivered?
- Do I have learnings from past A/B tests?
How much time do I have to develop this experience?
- Am I timeboxed by an offer date?
- Are market conditions changing rapidly?
- Is this a response to viral marketing or a crisis?
How valuable is a win in this space?
- Is it a significant portion of this quarter’s revenue?
- Do I have other experiences of equal or greater value?
- What are the consequences of poor performance?
What capabilities do I have at my disposal for optimization?
- Are we able to segment audiences and run an A/B test?
- Can I deliver rules-based personalization based on past insights?
- Do I have a content recommender or bandit-optimization system?
For the optimizers in the audience, you’re probably thinking this looks a lot like the PIE framework and you’d be right. PIE stands for Potential, Importance, and Effort and it forms the base layer for intelligent optimizations. With PIE, we are able to determine which experiments are worth running and rank order them through the scoring system. By adding in our available intelligence capabilities, we can match up the right effort per experience.
Next implement scoring potential and importance
Every organization uses different methods for scoring potential and importance, but the key here is that whether you use 1-10, 1-5, smiley face emojis or High, Medium, Low, make your voting democratic. Great optimization teams consist of engineers, product managers, designers and, potentially, data analysts/scientists. Make data available to all parties and vote independently. Tally those scores and find your weighted averages.

The scoring in this example is for illustration purposes only
In this example, you can see that each test idea has two core rating outcomes. First, you can see how each team rates the hypothesis across PIE on the X axis and on the Y you can see the rating for each category.
This works especially well when you have many ideas and locations you’d like to test, but what about that time-boxed landing page of ours from the example? In that case we know we’re going to optimize it, but are not sure how to use our available time window effectively.
Let’s go back to our landing page anatomy and apply our initial scoring model against those areas.
Now that we have broken down the experience into separate priorities, we can look at the levels of intelligence through the lens of effort vs. reward. If you are already using a sophisticated auto ML capability that takes in hundreds of features and context, congratulations, you may be able to solve most problems with your current pipeline. For everyone else, we will need to review capabilities against cost and potential gains.
Below is a generic inventory of testing methods/intelligence services a team might use to determine the right application of effort and risk against an experience.
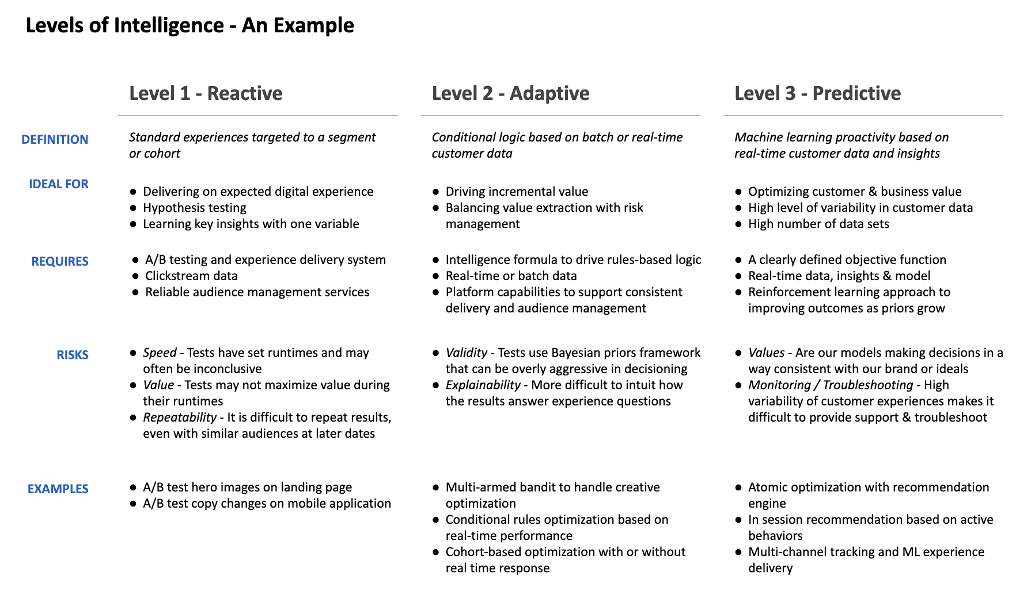
As you can see in the chart above, we are not making discrete claims of value for each level of intelligence. Oftentimes a rules-based optimization based on past behavior could extract 95% of the value of a sophisticated deep learning algorithm at only a fraction of the cost. It can be tempting to overpower your objectives with technology, but experience testing multiple methods will help you learn which is appropriate for the situation and size of outcome.
A general example of the framework in action
In the general example to follow, we’ll use generic data, acquisition rates and importance scores to understand how to weigh our choices around where and when to use each level of intelligence.
In this hypothetical example, we’ve determined that our landing page URL will be sent to 2 million of our finest customers. We’ve already segmented our total customer set into the top two deciles of likelihood to respond and that gives us a round number of 2 million emails. Let’s assume we do not A/B test or further optimize the email itself in this example, although you better believe we would in the real world.
Let’s say our historical estimates assume a .5-1% CTR for the email to the landing page. That gives us 10,000-20,000 visitors likely to land on that page. Additionally, let’s say the product we’re selling is worth approximately $100 and has a gross margin of 40%. That means $40 in incremental revenue for every conversion. If we believe we’re amazing and can convert 10% based on similar campaigns, that gives us a net range of $40,000-80,000 for our potential outcome. We may, given our methods, be able to push that percentage a few points up or down.
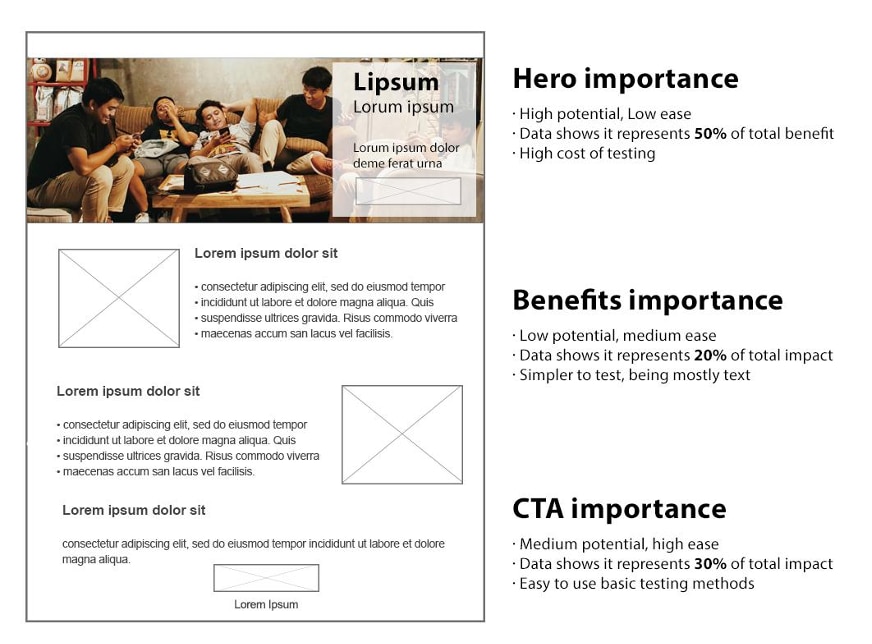
This is where our levels of intelligence comes in. We’ve decided to run the campaign and we know a general range of its opportunity size. We have three zones on the page we can optimize. How do we determine methods for each zone, if at all?
The Hero (50%)
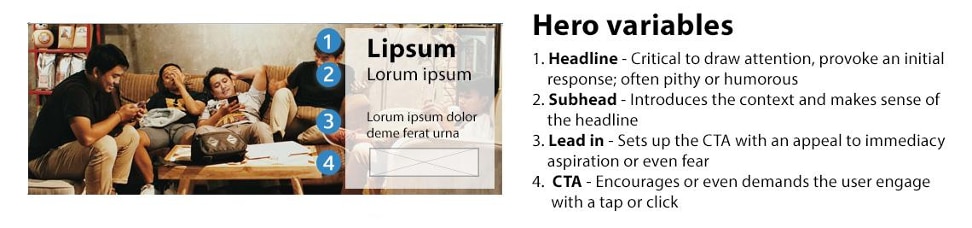
Our lead-in space helps set the mood and drives customers down the page with a draw that could be emotional, conscious or aspirational tone. It’s often one of the most valuable methods for driving conversion. Since our net upside here is around $40k, how much effort and complexity should we apply? Knowing we have a relatively small audience and time window, does that change your decision?
If I think that the hero is worth 50% of the total optimization value, I would think about using the right balance of intelligence to return. A multi-armed bandit from intelligence level 2 could be viable here if you have a long enough time window and your bandit can start updating traffic allocations within a week. 3-5 highly diverse creatives could be used to drive to a single winning creative for your pre-compiled segment. Somewhat expensive, complex, but reasonable if your systems allow.
If you have automated systems for recommendations in place and deep enough knowledge about your prospects (you targeted them directly with an email), try for level 3 intelligence and track your performance lift above other methods. Only through experience will you develop the right patterns for your unique user experiences and customers.
The benefits (15%)

The benefits section exists to confirm user intent to purchase, answer questions and highlight use cases that are desirable to your customer. Historically, you see this section having a 15% impact on net sales. We’re already running a MAB on our hero so what might we do here to avoid unneeded complexity, but still get value?
One approach might be to do nothing. The complexity of a multivariate test analysis is high and the relative value of the zone is low. If your other 2 zones are well crafted, no intelligence can often be the right answer. Detecting a measurable effect here is likely going to be difficult with the given audience and level of impact. We could run a simple A/B test, but our time might be best spent against zones 1 and 3, where 85% of the impact lives.
The call to action (35%)

Now we’re at the heart of things. This is where the visitor decides to buy or abandon (ignoring the shopping cart element). There is often a form, button, etc that leads the user through the signup or acquisition process and the role of colors, shape, design, visuals can either confirm the intent to purchase or lead to abandon.
We often spend much time here, tailoring button colors, shapes, CTA language. If you determine that your CTA is valuable (35% impact in our example), then you may be looking at something in the level 2 intelligence range. A combination of known cohorts, rules or more sophisticated testing methods like multi-armed bandits are available. In our example the dollar value is relatively low and our time is short so I’d likely opt for rules-based optimization that uses past behavior to cohort and deliver experiences in a more targeted A/B test.
In any case, you’re matching your opportunity size, cost to execute and available technologies against each experience to bring balance to the testing force.
Conclusion
Building your design of experiments, like most things in life, is all about preparation. This process is designed to help reduce waste so that you can run more and better tests in the future, maximizing your insight rate.
- Evaluate the overall priority of your hypothesis/testing area with a method like PIE - Ensure all parties can participate fairly in the rating system
- Review the business performance of each area of your experience to determine where effort should be best spent for ROI
- Apply the levels of intelligence framework against those identified opportunities to minimize the cost of testing, while balancing the value extracted from the experiment or optimization
With this process in your toolkit, continue to review your testing velocity, win rates, cost per experiment and overall ROI of your testing program. There’s nothing better than having data to support your decisions, not just about what variation is winning, but how you got to the testing methods and hypotheses themselves.
**Background vector created by GarryKillian - www.freepik.com


