Why Google HEART framework? Definitions, reliability & value
Learn how the H.E.A.R.T. framework (Happiness, Engagement, Adoption & Retention, Task Success) applies to enterprise applications.
Companies want to create products that provide business value. Customers are at the heart of business value: They use (or don’t use) products and only they know what they experience each day. Meanwhile, many software engineers focus on building products, but rarely talk with customers. Product Managers bridge the gap between products and customers by learning about customer pain points, championing findings, and collaborating with engineers to devise and implement solutions.
But how can we better understand our customers? How can we gauge their product experiences and identify opportunities to solve their problems while at the same time satisfying our stakeholders?
One approach is the Google HEART framework, which offers five metrics to monitor the user experience. The HEART framework readily applies to consumer and B2B applications, where the customer exists outside the walls of the company. However, with the rise of Product Management in DevOps and enterprise applications, many companies also apply the framework to customers who exist within the company.
Firsthand experience applying the HEART framework to enterprise applications
At Capital One, we’re expanding our Product Management practice to support enterprise applications. In 2021, I joined as the first Product Manager for two enterprise applications in a department new to the Product Management discipline. Teams relied on their experiences as engineers to build products for other engineers with few little interactions (beyond support tickets) with their ultimate customers.
As a Product Manager, I focused on the customer and gathered and reviewed available feedback and product usage information. Where the data didn’t exist, I worked with engineering teams to determine how we could collect and report on the data.
The HEART metrics framework helped me share the results with stakeholders in a way that built empathy for our users and provided insight to make data-driven and user-centric decisions. It also supplied the metrics I needed to prioritize a long-delayed UI for a complex application.
H.E.A.R.T. metrics and criteria defined
In 2010, Google introduced the HEART framework to track user experience with five high-level, user-focused metrics.
Previous frameworks focused on vanity or PULSE metrics (Page views, Uptime, Latency, Seven-day active users, and Earnings) to understand the user experience. However, PULSE metrics were low-level, direct indicators of user experience that do not represent the true experience.
Source: Google Inc.
HEART framework metric criteria
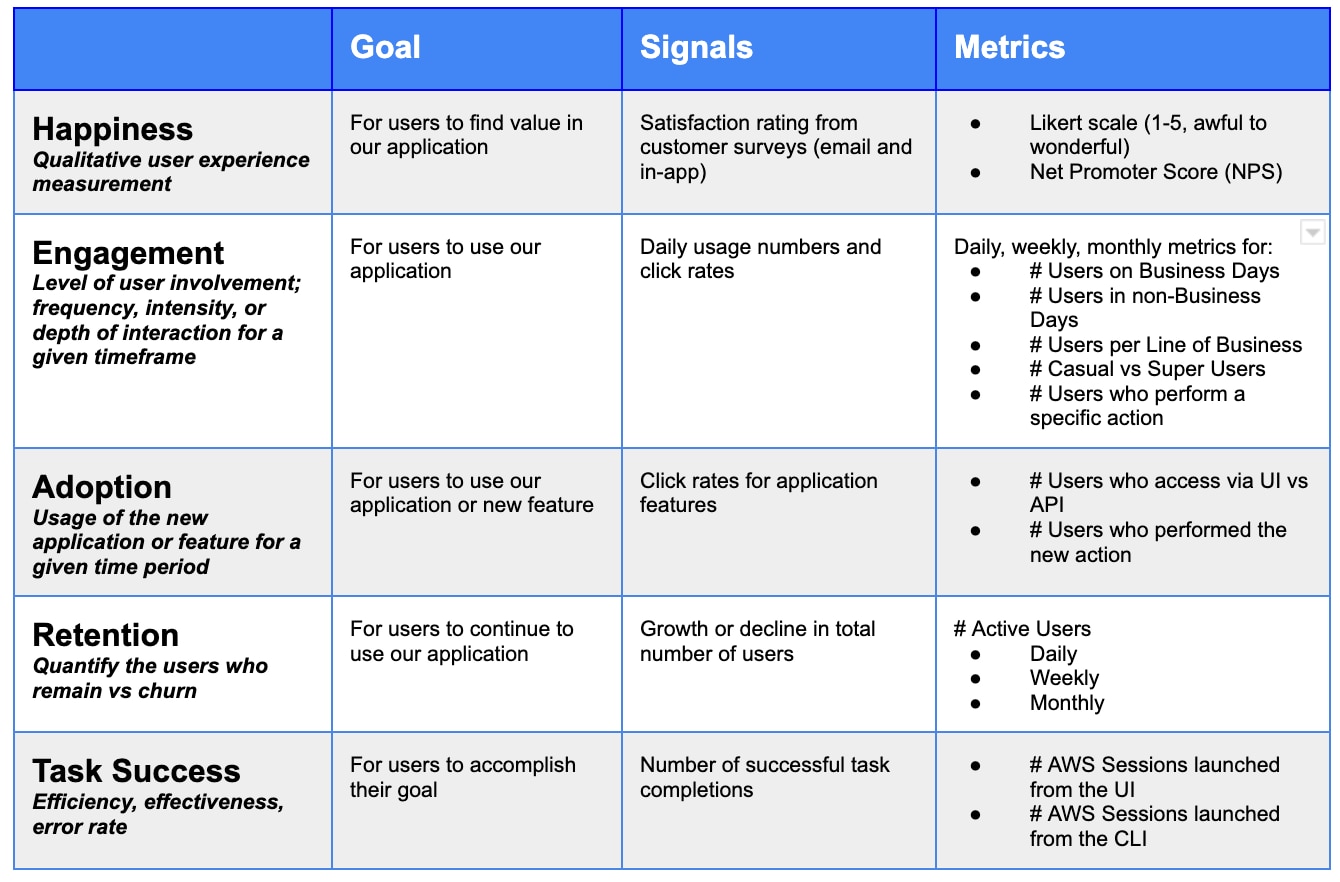
Google applied three criteria to each HEART Metric: Goal, Signals, and Metrics.
-
The criteria ranges from the qualitative to the quantitative.
-
A Goal is a high-level description of what we want to achieve.
-
Signals indicate what we can measure as we work toward our Goal.
-
Metrics include concrete data that can show our progress.
Happiness
Happiness is the state of being happy, which varies based on individual user attitudes. It’s relative and hard to quantify. In the HEART framework, Happiness is measured with user surveys.
Within a few months of joining Capital One, I introduced quarterly surveys for my applications. Surveys allowed me to:
-
Track baseline metrics to use in comparison to future surveys.
-
Gather feedback, including customer likes, pain points, and ideas.
-
Prioritize roadmap items.
-
Identify contacts for follow-up interviews.
Engagement
Engagement captures the user’s involvement. For consumer-facing web applications, the user equates to the person who logged into the application. This is not as straightforward for enterprise applications.
One of my applications is an internal website used by 4K+ users daily, so I could use User Activity Tracking tools to retrieve vanity metrics. However, it took additional digging to discover data on super users, total active users within the past 60 days, etc.
But what do you do if your application doesn’t have a front-end? How do you define a user? Does a user have to be human?
My other application allows its (human) users to configure machine-to-machine application secrets management. Until recently, it did not have a front-end. For this application, I track both human and machine metrics for things like:
-
Did a human perform an action, like create a new record?
-
Did an application use our application to communicate with another application? Did it read or write data?
Adoption and retention
Adoption looks at new users while Retention tracks the longevity of all users. For a consumer application, this helps distinguish total usage between new and existing users and how long users remain customers.
However, Adoption and Retention are not straightforward for an enterprise application, particularly when the application is required by the company. Any new user usually equates to a new employee and retention continues as long as they’re employed. The HEART framework calls out that not all metrics apply to all applications. For me, Adoption and Retention fall into the “difficult to determine for enterprise applications” bucket.
Capital One mandates the use of both of my applications. For one of my applications, any user who wants to access AWS must use the UI. Adoption and retention of the application correlates to the user’s employment status while tracking a new feature provides visibility into its adoption. Additional data collected helps me better understand usage across the many lines of business.
My other application focuses on machine-to-machine secrets management. Its backend “users” are other applications. Adoption and retention correlate to API connectivity. When I compare the adoption to Total Addressable Market (TAM), it provides visibility into enterprise adoption for the new feature or application.
Data from surveys and customer feedback identified the need for a secrets management UI and allowed me to present a compelling case to stakeholders to prioritize it. When it’s released later this year, I’ll be able to track its human user adoption in terms of application and feature usage.
Task success
Task success tracks behavioral metrics like:
-
Efficiency
-
Effectiveness
-
Error rate
The ability to gather and analyze task success information depends on the application, regardless of consumer vs. enterprise. Task Success Efficiency includes tangible metrics like search results and response times. Effectiveness is the ability for the user (human or machine) to do what it needs to do, whether it’s creating a new account or retrieving information from another application. The Error Rate impacts both efficiency and effectiveness: Can the user access the application and do what they need to do?
My UI application integrates with a User Activity Tracking tool that logs its interactions. Interaction data helps me understand the most (and least) used features and where users abandon the task before success.
For my machine-to-machine application, Task Success means that the applications were able to communicate with each other efficiently and effectively.
How surveys provide user-centric metrics
I kept the survey simple and asked minimal questions to decrease the time to complete and increase the response rate. I limited it to three questions, where only the first required a response.
-
How likely are you to recommend <<Application Name>>? (Likert Scale selection with 1 = Definitely Not Recommend and 5 = Definitely Recommend)
-
What do you like most about <<Application Name>>? (Open text answer)
-
How could we improve your experience with <<Application Name>>? (Open text answer)
The overall experience question provided the data for an NPS (Net Promoter Score). The NPS Trend - Likelihood to Recommend chart shows the calculated NPS results for the last five quarters for my complex, secrets management application.
The NPS chart tells two distinct stories. The first is the 16-point jump in 2022 Q4 that coincided with complex changes that impacted most of our user base and required development teamwork. However, because of outstanding customer support, the team turned a potential negative into a positive.
The second is the 21-point drop in 2023 Q2 that occurred after two stable quarters where the team released minor changes. Was the drop caused by one of these changes? DId the changes not go far enough? Next quarter’s result combined with customer outreach this quarter may lead us to an answer.

The other survey questions allow users to share feedback, which often translates into additional feature analysis and definition. For my AWS application, user feedback allowed a new feature to jump the backlog queue. For my secrets management application, it provided me with the data to prioritize a long-delayed UI application.
Final thoughts—HEART results are valuable
The HEART framework should be a tool in every Product Manager’s toolbox. When you attach goals, signals, and metrics to each of the five categories, you’re forced to identify the metrics that matter and determine ways to gather, analyze and share the data.
For me, at first, it was a challenge to run the surveys and gather and analyze data while simultaneously performing all other product management responsibilities. However, once the cadence was established, it got easier. The HEART results are valuable; they provide a way to share the user experience with stakeholders, build user empathy, and make data-driven and user-centric decisions.


