Ablation studies to validate XAI methods for tabular data
Discover what an ablation study is and how this powerful technique validates XAI methods and enhances transparency.
Explainable artificial intelligence (XAI) methods lack ground truth. In its place, method developers have relied on axioms to determine desirable characteristics for their explanation behavior.
For high-stakes uses of machine learning models that require explainability, it is not sufficient to rely on axioms. The implementation of its design can fail to accurately evaluate complex model behavior built on real-world datasets.
At Capital One, our goal is to build trust in deep tabular model explanations through rigorous experiments and evaluation.
What is an ablation study?
An ablation study is a procedure frequently used to assess XAI method utility and, to some extent, their fidelity is an ablation study. An ablation study removes parts of the system in order to gain a better understanding of its overall behavior. In AI solutions, ablation studies help determine the impact of specific features or model components on predictions, enhancing transparency and trust in explainable AI methods.
Ablation studies, in the context of XAI evaluation, iteratively remove feature information from observations based on feature importance rankings and assess the sensitivity of machine learning model performance.
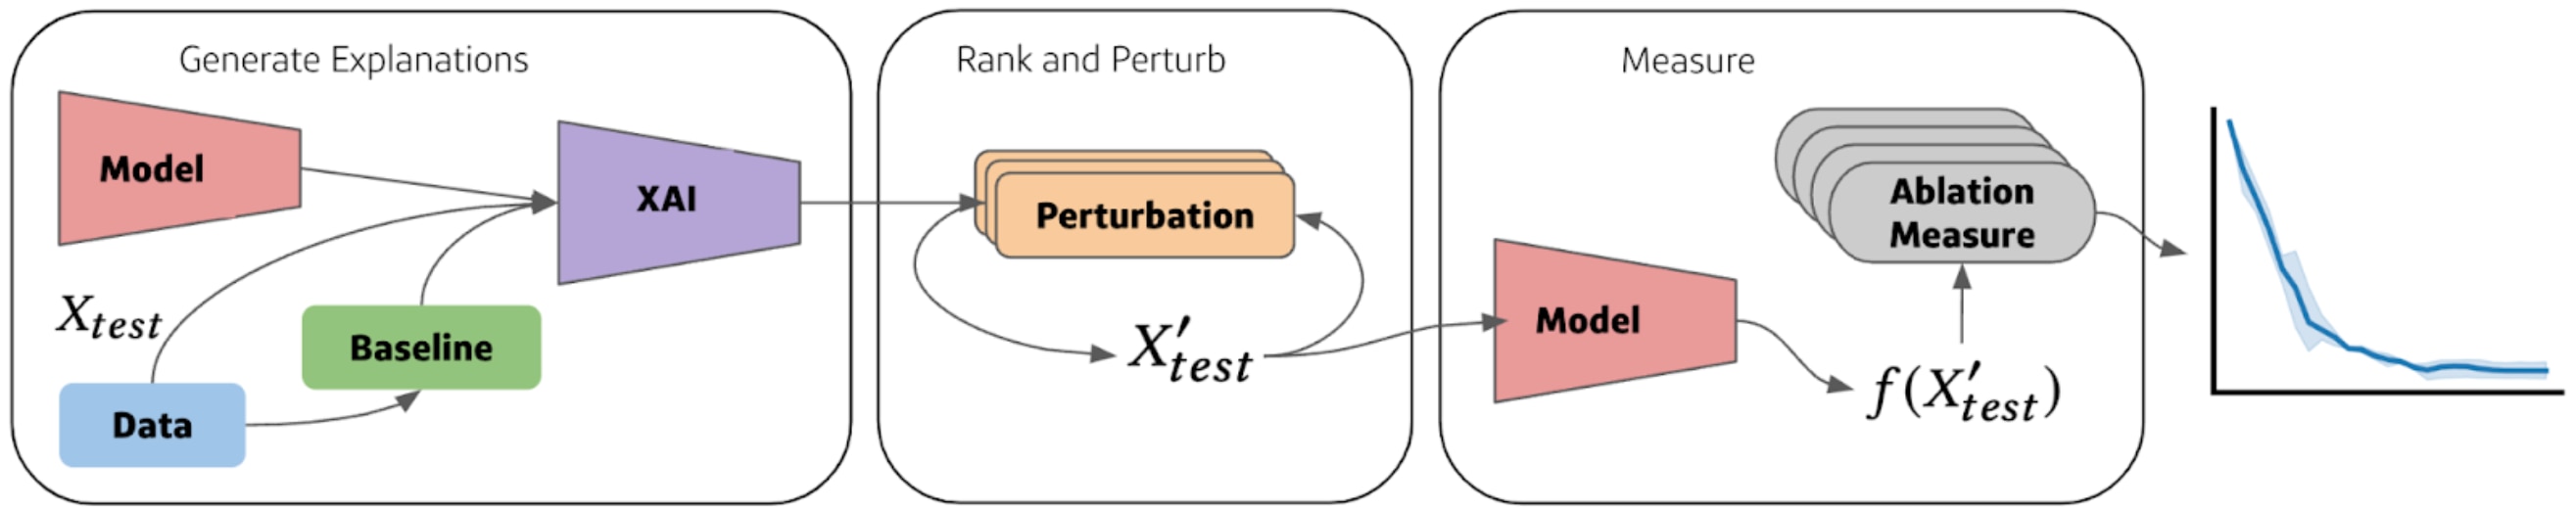
Figure 1: Diagram of data and logic flow for an ablation study. The process starts with a trained model, an XAI method, and a reference distribution generated from training data called a baseline. Features of test samples to be explained are rank ordered and perturbed in order of importance and assessed with model capability. The series of ablation steps are summarized in an ablation curve (far right).
While the intent for data management is clear, the actual implementation details have yet to be studied rigorously for tabular data.
-
In our paper, BASED-XAI: Breaking Ablation Studies Down for Explainable Artificial Intelligence (KDD MLF 2022), we propose guardrails to avoid flawed conclusions, develop a more robust treatment of categorical variables and show how to identify more effective XAI methods given a pre-trained model and dataset.
-
We have released our methods in the ablation repository and PyPI for full reproducibility of our paper and future research directions.
XAI methods and baselines in ablation machine learning
In our ablation study paper, we experiment with post-hoc XAI techniques that generate local attributions (e.g., SHAP, Integrated Gradients). AI research on post-hoc explanation methods often require hyperparameter choices, the most influential of which are baselines.
Baselines, also known as reference distributions, are necessary to contextualize explanations without model reconfiguration or retraining. Explanations are useful in that they explain the contributions of features toward an observation’s prediction relative to the baseline observations or distribution.
The effect baselines have on post-hoc explanations can be easily seen in the image domain. Sturmfels et al. visualize attributions from Integrated Gradients (IG) using other reference images besides the usual black pixel baseline image. Varying baseline reference colors cause significant variation in the assigned attribution.
Notice, in Figure 2, how the location of the high-intensity pixels from the attribution map change from the white input pixels to the black input pixels of the killer whale. While there is less attribution given to background pixels with the colored baseline, the same model and post-hoc method with two different baseline configurations fundamentally disagree on what part of the whale is important. This underscores the lack of ground truth in XAI methods.

Sturmfels et al comparison of Integrated Gradients attributions given different baselines with the same image and model. https://distill.pub/2020/attribution-baselines/
When it comes to tabular data, a simple visual inspection is much more difficult. This time-consuming analysis should follow methodological guidelines to ensure clinical relevance. In practice, baselines in tabular data are often samples from the training dataset but there are numerous other choices available for model developers.
As shown in the killer whale example, it is difficult for practitioners to select an appropriate baseline when applying a post-hoc XAI method. Ablation can help to select baselines, whose effectiveness could vary depending on the specific model, as above, or on the dataset, model and other hyperparameters.
Ablation plot model elements
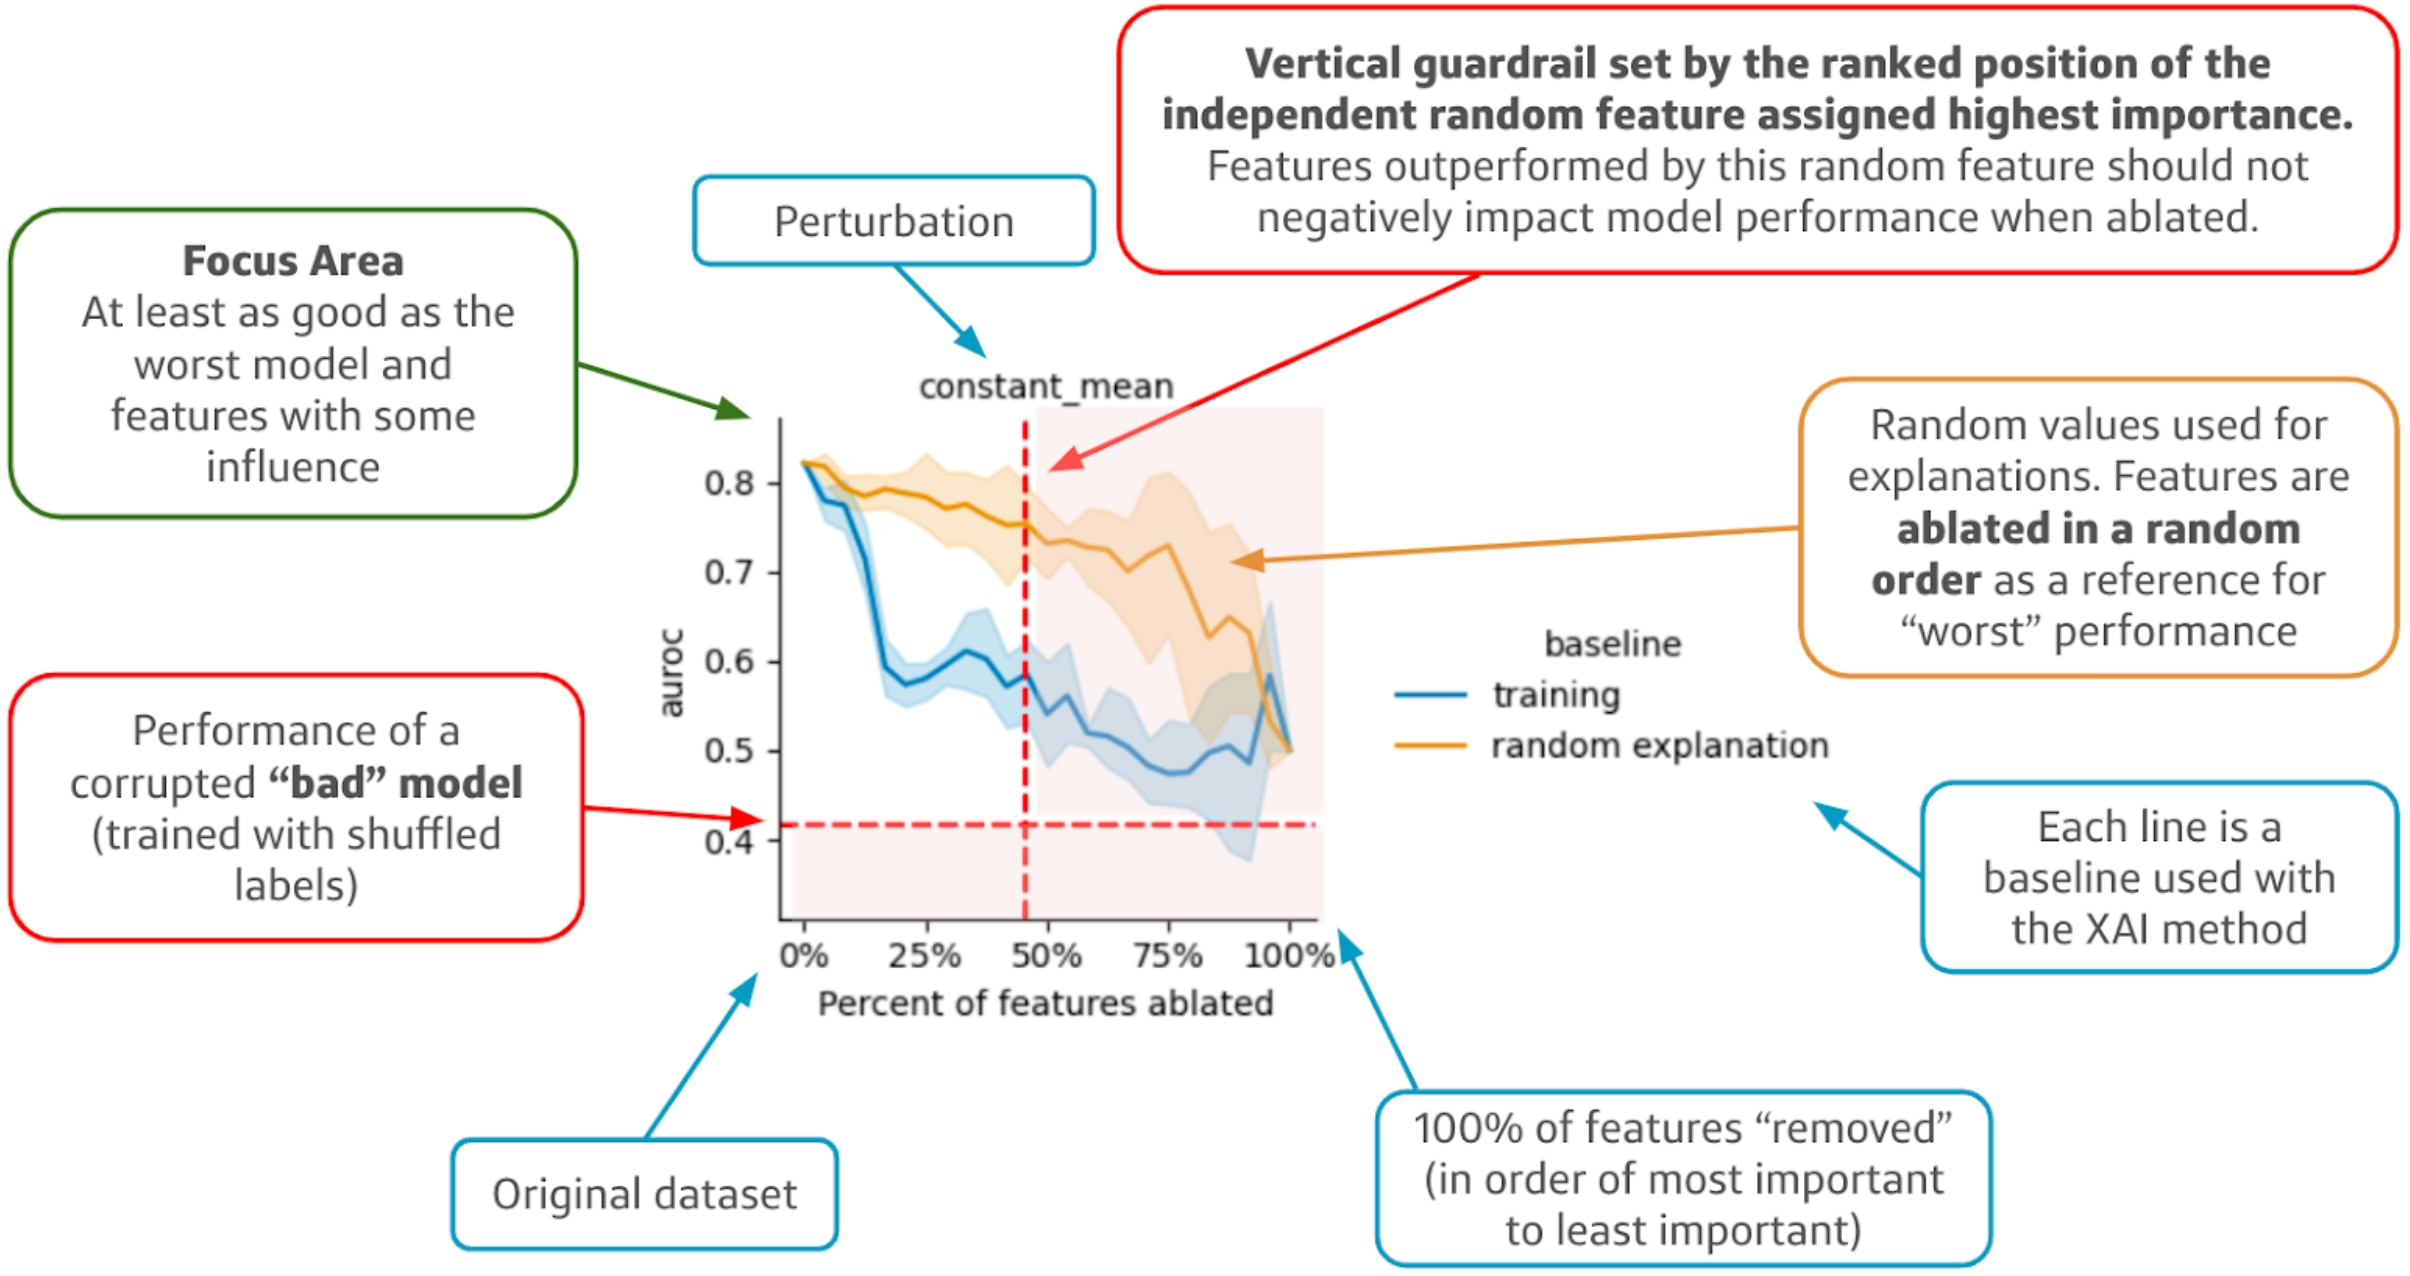
An ablation plot shows model performance (y-axis) degradation as a function of the number of features “perturbed” (x-axis) in order from most important (left) to least important (right), as determined by a set of explanations.
In Figure 3, we use a constant mean perturbation which implies that, at every iteration, we replace the next most important feature by the average value of that feature in the training data. The goal for each perturbation distribution is to remove important information from the observation effectively.
An example of an ablation plot.
- The blue line represents the ablation curve generated when using SHAP with a training baseline. Instead of using a constant value for a baseline, similar to the image example in Figure 2, a training baseline is a sample of observations from the training data over which explanations are summarized. The other lines encode our guardrails.
-
The orange line simulates ablation using non-informative explanations. Non-informative explanations are created by assigning feature importances and ordering based on uniformly random assigned importances. The further an ablation curve is below this line, the better.
-
The horizontal red line represents a model trained on shuffled labels. Any ablation curve that goes below this line may mean there are odd out of distribution effects from perturbations.
-
The vertical guardrail represents the lower level of explainability. This guardrail is generated by adding random features to the dataset with no predictive power. Features assigned to the right of this guardrail likely have little influence on model predictions.
A good explanation method will rank features with any influence ahead of these random features, indicating that our focus should be on the upper left quadrant of the ablation curve results. This architecture allows for additional layers in machine learning models to be included, potentially enhancing their function.The other three quadrants contain variations from perturbing features that shouldn’t have any influence on model capability.
Ablation machine learning in action
Anyone can easily run experiments from the Based XAI paper using the scripts provided in our KDD section of the ablation repo. To run a custom experiment, all you need to do is update the configuration file with the desired settings.
from ablation.experiment import Config, Experiment
config = Config.from_yaml_file("config.yml")
# Initialize experiment from config
exp = Experiment(config)
# run ablation experiment
results = exp.run_exp()
Results will be in the form of a dataframe with metrics aligned to the ablation of each feature for a specific trial. This includes the model score, explanation importance, and the random feature sanity check. To generate plots, a variety of plotting scripts from the paper can be found in the visualizations directory.
If you are more interested in your own dataset and model that is not yet supported by ablation models, we have provided example notebooks for model agnostic generation of ablation curves.
A simplified version of the model agnostic workflow looks like this:
# Train your own model
from sklearn.ensemble import RandomForestClassifier
rf = RandomForestClassifier().fit(X_train, y_train)

#Generate your own explanations
from shap import TreeExplainer
te = TreeExplainer(rf)
shap_values = te.shap_values(dataset.X_test)[0]

# Generate an ablation curve
from ablation.perturb import generate_perturbation_distribution
from ablation.ablation import Ablation
perturbation = generate_perturbation_distribution(
    method="marginal", X=X_train, X_obs=X_test
)
# provide perturbation distribution, model, data, and explanations along with other information
abtn = Ablation(perturbation,  rf, X_test,   y_test, shap_values, …  )
result = abtn.ablate_features()
Advancing XAI methods & development with ablation studies
XAI method fidelity is a problem that many impactful domains, such as healthcare and finance, grapple with when attempting to build trust in ML models.
The Capital One ablation repository supports the full reproducibility of the experiments in our paper and provides a foundation for future research, collaboration, and expansion of robust XAI evaluation through ablation studies.
As we expand upon this research and functionality for internal use cases, we hope to improve XAI evaluation and integrate ablation as a part of broader emerging frameworks (e.g., CARLA, OpenXAI) that focus on XAI benchmarking.
Other contributors to this article include Daniel Barcklow, Manager, Machine Learning Engineering, Applied Research, and Brian Barr, Senior Lead Machine Learning Engineer, Applied Research.
Explore Capital One's AI research and career opportunities
New to tech at Capital One? We touch every aspect of the research life cycle, from collaborating with Academia to building leading-edge AI products:
-
See how our AI research is advancing the state of the art in AI for financial services.
-
Learn how we’re delivering value to millions of customers with proprietary AI solutions.
-
Explore AI research jobs and join our world-class team in changing banking for good.


