Building data observability for Snowflake data applications
Learn about the cloud-native architecture that Capital One leverages to build data observability into its Snowflake applications.
Presented at Snowflake Summit 2023 by Lakshmi Phani Kommaraju, Sr. Lead Software Engineer at Capital One Software and Brad Culberson, Principal Architect, Field CTO Office at Snowflake.
Embracing cloud-native architectures
More than 85% of companies plan to embrace a cloud-first principle by 2025 and will depend on cloud-native architectures and technologies to realize their digital strategies. As the volume and complexity of data grow with the adoption of cloud environments and cloud-first initiatives, companies increasingly need ways to maintain the performance and reliability of their data in their applications. That’s where data observability comes in.
Data observability is the ability for companies to monitor the health of their data in real time. With data observability in place, organizations can preserve the trustworthiness of their data no matter where it’s stored. They can also gain a view of their data across systems and applications coupled with a proactive way to prevent outages and poor experiences.
In June of 2023, we presented at Snowflake Summit on how Capital One designed and built our own monitoring and observability solution for Snowflake data applications. Let’s review the importance of data observability and the steps we took to ensure the quality and performance of Snowflake data pipelines in our product Slingshot.
What is data observability?
Data observability is the practice of ensuring the accuracy, trustworthiness and availability of data at any given time. It involves monitoring and analyzing metrics to measure data quality and health, detect anomalies and identify issues. The goal of data observability is to make certain that data is always accurate and available for downstream applications, such as analytics or machine learning. Additionally, data observability ensures there are ways to address issues or inconsistencies immediately, which lead to greater customer satisfaction and increase the reliability of data across an organization.
Data observability also plays a crucial role in helping data teams gain visibility into their data usage and troubleshoot problems more quickly, which saves the company money and frees up team members to pursue more value-generating opportunities.
The foundation of monitoring and observability is the data generated from sources such as metrics, logs and traces. Companies today can keep track of the health of their systems using the following tools:
- Metrics include the numbers behind the services that reflect performance and usage.
- Structured logs reveal what’s happening inside the system in great detail through insights into events and errors.
- Traces provide an in-depth breakdown of performance as data flows through a system across different components or services.
- Health checks simulate user behavior, verify functionality and run integration tests.
- Dashboards build reports and look at systems, how they are running, availability, uptime and performance. The dashboards report on targets defined by the organization through the SLO (Service Level Objective) and SLA (Service Level Agreement).
- Alerts are usually built on top of dashboards to notify teams on a daily or weekly basis of any issues or customer experience concerns that need to be addressed or investigated.
Getting started with data observability
The best place to begin with building data observability in your organization is with the customer experience. Your tools should allow you to verify that your application is meeting customer expectations and your features are working as you intended. You may also have contractual agreements on performance or availability to maintain in your metrics.
A company can understand if features are working correctly using synthetic tests, which simulate customer behavior in order to verify the system works. The challenge with this approach is in the difficulty of finding and testing every use case and the variability of systems over time. An alternate approach, called real user monitoring, allows for the monitoring of systems in place. This way, a business can see if users are encountering any issues in real time.
Sometimes systems get more errors over time or become slightly slower each week. These patterns are difficult to notice without a dashboard in place. With observability, one can proactively research and correct a system degrading in performance over time before it impacts the customer negatively.
Common metrics that engineers find important to track to understand the health and utilization of services include:
- Queries per second on warehouses
- Average query performance by feature or workload
- Failures and timeouts
- Query queue depths
- Number of active clusters
- Aggregations by success, failures and timeouts
For example, with a dashboard view into these metrics, a company can detect that a new feature came out at the same time the queries per second dramatically increased, leading to excess load on the system and potential outage. Observability allows an organization to notice when their systems are getting unhealthier over time and track trends and run comparisons that bring valuable insights.
A case study on data observability: Capital One Slingshot
Let’s take a look at how Capital One addressed the need to monitor and maintain the health of our data pipelines through building observability into our product Slingshot.
In 2017, Capital One began moving our entire data ecosystem to the cloud and needed a partner to help us manage and scale our data in the cloud. We chose Snowflake as our data cloud platform, a decision that allowed us to scale our data processes quickly and gave our data engineers the freedom to focus on creating more value for our business. Over time, we realized we needed a way to better manage our data and workloads on Snowflake. We built the tools internally that would become Slingshot, a data management SaaS solution that helps businesses on Snowflake maximize their investments by empowering teams to spend wisely, forecast confidently and make smarter decisions.
How Slingshot processes data
In Slingshot, we onboard and support tenants in different Snowflake accounts using multiple cloud providers such as Amazon Web Services and Google Cloud Platform. Metadata from tenants undergoes transformations before being shared or replicated as tenant-specific databases in our Primary AWS East Snowflake account. We run our data pipelines on a schedule, validate incoming data, transform it based on stated parameters and push the data into our Slingshot database. Features then apply their own transformations and validations to make the data consumable by Slingshot. Tenant users access features from Slingshot, which runs in a separate AWS account.
Stored procedures handle most of the transformation and data processing activities, while we use tasks for scheduling purposes.
As you can imagine, in a complex system where data is moving between several cloud environments in different tenant accounts, it becomes crucial to identify and address anomalies or inconsistencies right away.
Three steps to data observability
In such a system, how can we ensure we will meet our goals of delivering high-quality data on time? We developed a three-step approach to start building monitoring and observability into our applications.
Step 1: Detect - Proactive monitoring
We wanted to proactively monitor the overall health of the data processes running in Snowflake. Monitoring activities include checking for: data freshness to see if all the data pipelines were completed successfully; volume and quality for whether we received the right amount of data for the number of rows and columns as well as their values; and latency of data pipelines to ensure they were below the SLA.
Step 2: Notify - Timely stakeholder communication
Once we detect errors or anomalies, we notify the stakeholders. The right parties must be informed at the right time so that issues get addressed in an optimal way.
Step 3: Act - Rapid remedial response
Lastly, we start remedial actions to rectify the situation. These actions could include acknowledging the alert and notifying the customers of the issue or restarting a data load job. Organizations should make sure their engineering and support teams have the tools and resources to assess the failure and take quick action. A fast response is crucial to resolving issues as quickly as possible and increasing customer satisfaction. Automating common remedial actions will also assist in quick resolution. For example, if we know a particular notification always requires a job to be restarted, automating that action will be beneficial.
Slingshot system health indicators
We also looked for ways we can determine the health of data processes running in Snowflake. We came up with the following indicators:
- Stored procedure failures: Inspecting stored procedures while performing data operations, validations and transformations identify in-process failures.
- Stored procedure execution times: Latencies in stored procedure execution times flags for us any processes that are taking longer than they should.
- Task failures: Many times, stored procedures are wrapped in a task and assigned to execute on a schedule. Tasks can fail, be suspended or be canceled. A canceled job means the task could not be executed due to resource constraints. A suspended job indicates that after an alternate task is performed, it’s not resumed. Task timeouts point to tasks taking longer than expected.
- Data freshness: If data load is delayed, we’re able to alert our tenants. This can be due to an upstream issue or process taking longer than expected.
- Object access failures: One of the most common issues is code that worked in lower environments fail to work in production in the same way. The reason most likely is the necessary access privileges or grants are missing.
- Object access history: Notifications help safeguard sensitive data through detection and alerting on access to sensitive data fields.
These indicators, along with others we have not mentioned, allow organizations to monitor and gain a baseline on the health of their systems.
How we built data observability in Capital One Slingshot
We looked at our existing tools for monitoring, performed an analysis and finally decided to build our own monitoring solution in Slingshot.
The solution was based on the following design tenets:
- Standardized logging: Logging is one of the building blocks of observability. We built a custom logging module, using JSON format to capture dynamic data elements that need to be logged, and instrumented it in our stored procedures.
- Configuration driven: We wanted our monitoring system to be simple, extensible and configuration driven. We captured thresholds through a configuration table. When onboarding a new configuration, we followed the three W’s approach: Which table or view we would look to for logs; What criteria we would use based on a logged field from the table, such as the amount of time to complete a job; and Who needs to be notified if the criteria was met.
- Self-service enabled: We encouraged adoption of our monitoring solution through self service. Engineers should have access to the tools necessary to onboard, check and modify configurations. They should also be able to onboard and offboard monitors and alerts along with onboarding and offboarding tenants.
- Scalable engine: The monitoring engine is a critical piece to observability and plays the role of orchestrator. It is implemented as a stored procedure wrapped in a task. The engine picks up configurations on a predefined schedule and checks them against the log stores for a condition match. When the engine detects the thresholds are breached, a notification is sent out to stakeholders..
- Integrate with existing tools: The solution should easily integrate with existing enterprise tools such as Pager Duty and other AWS cloud services.
- Observe multiple accounts: Since Slingshot typically runs in multiple clouds and regions, we wanted to be able to detect and alert issues from various Snowflake accounts.
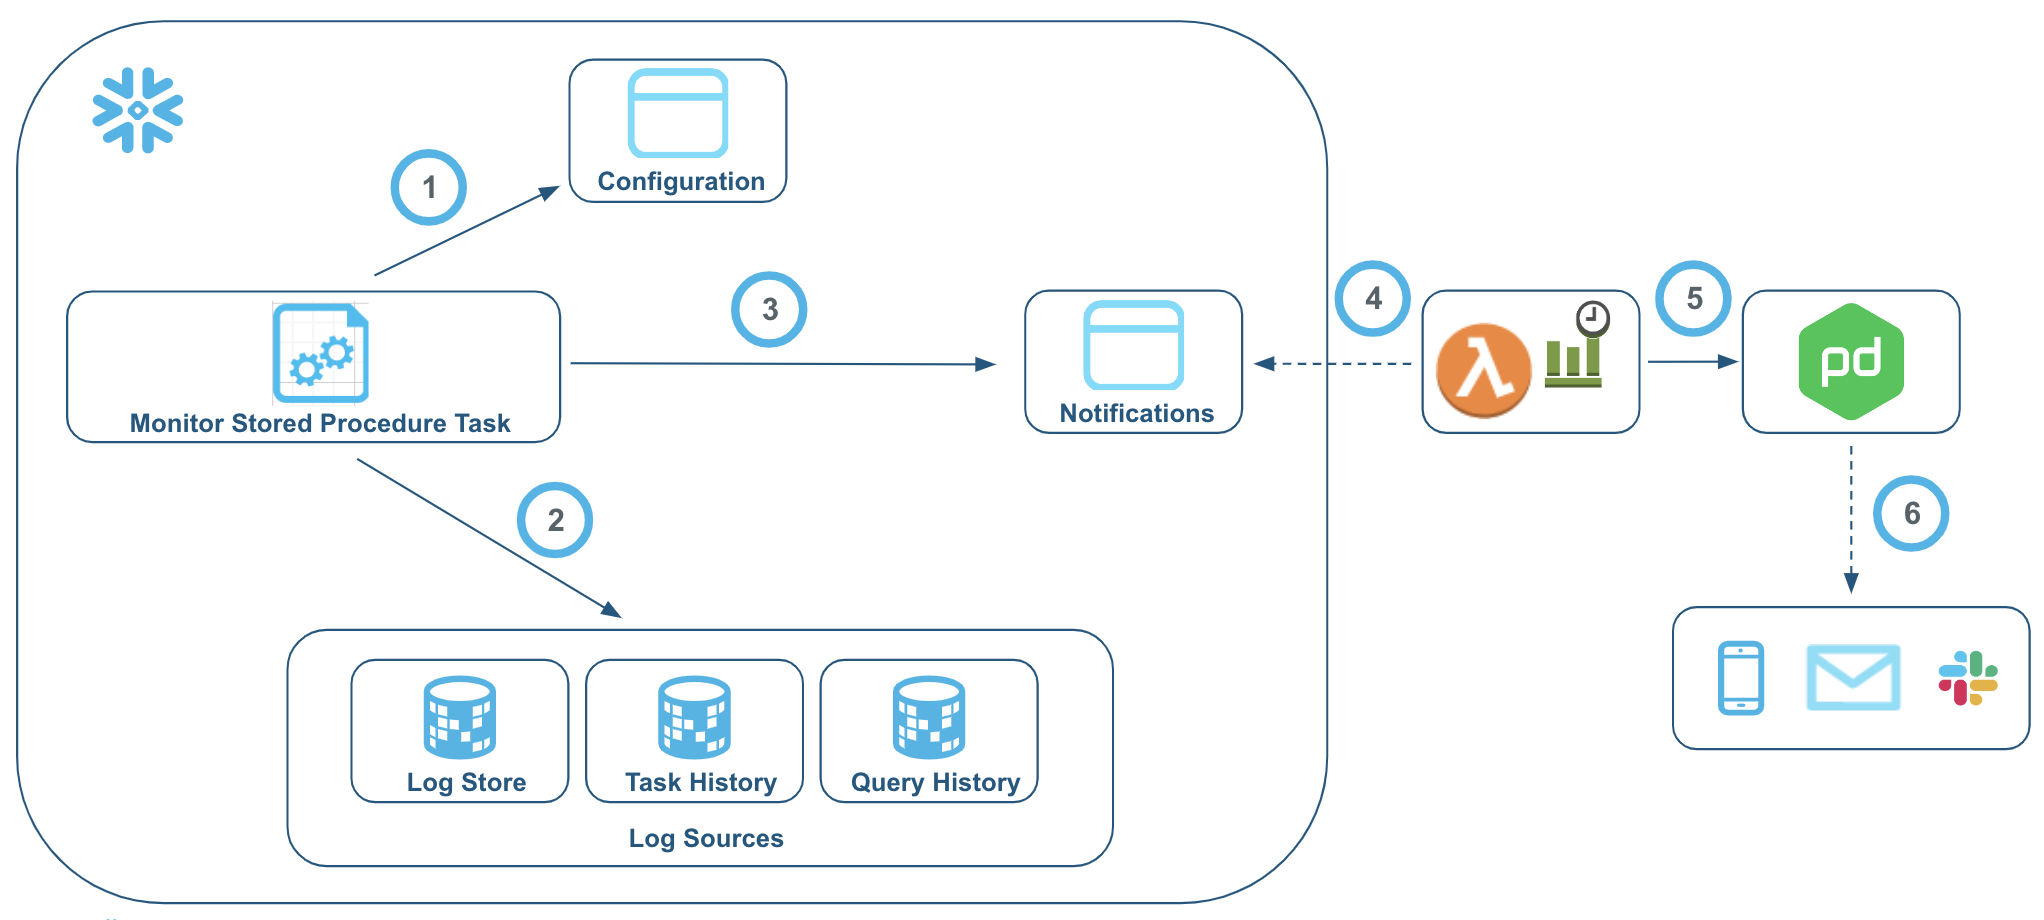
Use case: How it works in Slingshot’s production system
Let’s take a run through a sample use case to see how all of this works in Slingshot’s production system. The goal is to detect a condition if a daily load job did not run in the last 24 hours.
- The monitor stored procedure will wake up on a schedule and look into the configuration, which is the last load job run time minus the current time exceeds 24 hours.
- The solution picks up the configuration and comes to the log sources, specifically the log store, for when the daily load job was last executed.
- If the time is greater than 24 hours, a notification is triggered and sent through the channel selected by the user.
- At this point, the system engineering team or customer success team receives the notification.
Benefits of data observability
We have experienced several benefits from the monitoring solution we built. We self-identified issues in production around data pipelines that we proactively resolved. We detected and addressed performance issues quickly before they got out of hand. We also created a large number of alert configurations.
Lessons learned from building data observability and looking forward
Building a monitoring and observability solution allowed us to gain even greater advantages than previously from Snowflake’s capabilities. At the same time, we encountered several learnings along the way:
- The custom log library allowed us to get started with our solution. But in using the JSON format to capture the log information, at some point we anticipate hitting the 16 MB limit for JSON Object in Snowflake.
- Since we use regular tables for storing logs, there is a possibility of experiencing log table write concurrency issues if multiple stored procedures attempt to write to the log table at the same time. It can manifest as a performance issue in the original stored procedure. We currently have workarounds in place.
- Our approach to write logs from stored procedures is all or none. This means we log everything at the end of the stored procedure execution. The risk to this approach is if a stored procedure abruptly terminates, we would be left with no logs to go after.
We hope our learnings can help other businesses build monitoring and observability into their own Snowflake applications. In addition, Snowflake recently launched a new feature, Event Tables, to help solve some of the challenges we experienced. Event Tables allow logging data (events) in larger volumes without concurrency or performance concerns. This eliminates the need to create and join JSON documents and insert in batch, and thus the 16 MB limit on log information, as well as the concern for event loss on termination.
Concluding thoughts on building data observability for Snowflake
Rapid growth in cloud computing over the years has brought many benefits to companies, but also great complexity as enterprises seek to manage data spread across multiple cloud environments. As interest in new technologies for enterprises grows along with the large volumes of data necessary to feed these systems, data observability is set to play a crucial part in ensuring data pipelines contain clean and accurate data.
Building observability into your applications today empowers your engineers and stakeholders to monitor and optimize the performance of your data for more productive teams and happier customers.
Companies can advance their data journeys using Slingshot to solve data management challenges such as ensuring the health of their data in the cloud. Learn more about Slingshot and how it can help you maximize your Snowflake investment.


