Observability with automated customer journey graphs
Learn how Capital One builds automated customer journey graphs to improve observability and speed incident resolution.
The problem with current observability approaches
Uninterrupted availability of online customer-facing services is paramount for all organizations. Any disruption can impact consumers’ daily lives, negatively affect brand reputation and revenue, and expose organizations to financial and legal liabilities. Organizations heavily rely on observability tools to quickly detect and troubleshoot IT application outages, often investing in Site Reliability Engineering (SRE) expertise for faster incident resolution.
A key challenge with current observability implementations is their predominantly engineering-centric design. This is understandable, as they are typically developed by software and SRE engineers rather than business or product managers. This often results in dashboards filled with widgets displaying metrics related to application or infrastructure health, and monitors configured to alert support groups when predefined thresholds are breached. While real user monitoring (RUM) metrics may occasionally offer insights into customer impact, the expertise required to correlate these metrics with actual customer impact is often tribal knowledge that resides solely with engineers. This lack of transparency delays incident resolution and poses significant risks during incidents when key subject matter experts are unavailable, directly impacting end customers.
Ideally, observability dashboards should be built from a customer’s perspective, as software applications are designed to serve them. Our incident severity matrix is based on customer impact, and we collect metrics like customer transaction availability (CTA) to monitor this. However, troubleshooting an incident doesn’t typically begin at the customer layer. We believe it’s crucial to measure not only customer impact but also customer behavior, especially when the root cause stems from behavioral changes rather than infrastructure failures.
A system built to initiate troubleshooting from the customer layer—with drill-down capabilities to application and then infrastructure layers—would allow anyone to quickly understand issues without relying on tribal knowledge of the application or its interdependencies. We will demonstrate how we’ve begun building such capabilities through automation, leveraging existing features within our digital ecosystem.
Objectives and challenges in building customer journey graphs
Our digital platform offers a variety of products supported by different lines of business (LOBs) through their respective APIs. A complete customer experience or feature set constitutes a “customer journey.” These journeys are invaluable for troubleshooting incidents and accurately assessing real-time customer impact during outages.
Several teams have previously attempted to manually map these features and customer journeys, with limited success due to:
- Lack of subject matter expertise
- Complex API interdependencies
- Architectural drift over time
We need a programmatic approach to map these customer journeys, using trace metadata already present in our environment to create a “customer journey graph.” Our primary objective is to enhance incident troubleshooting by augmenting these maps. We also believe this approach can provide LOB product teams with additional insights into customer behaviors that are useful for marketing, A/B testing and more.
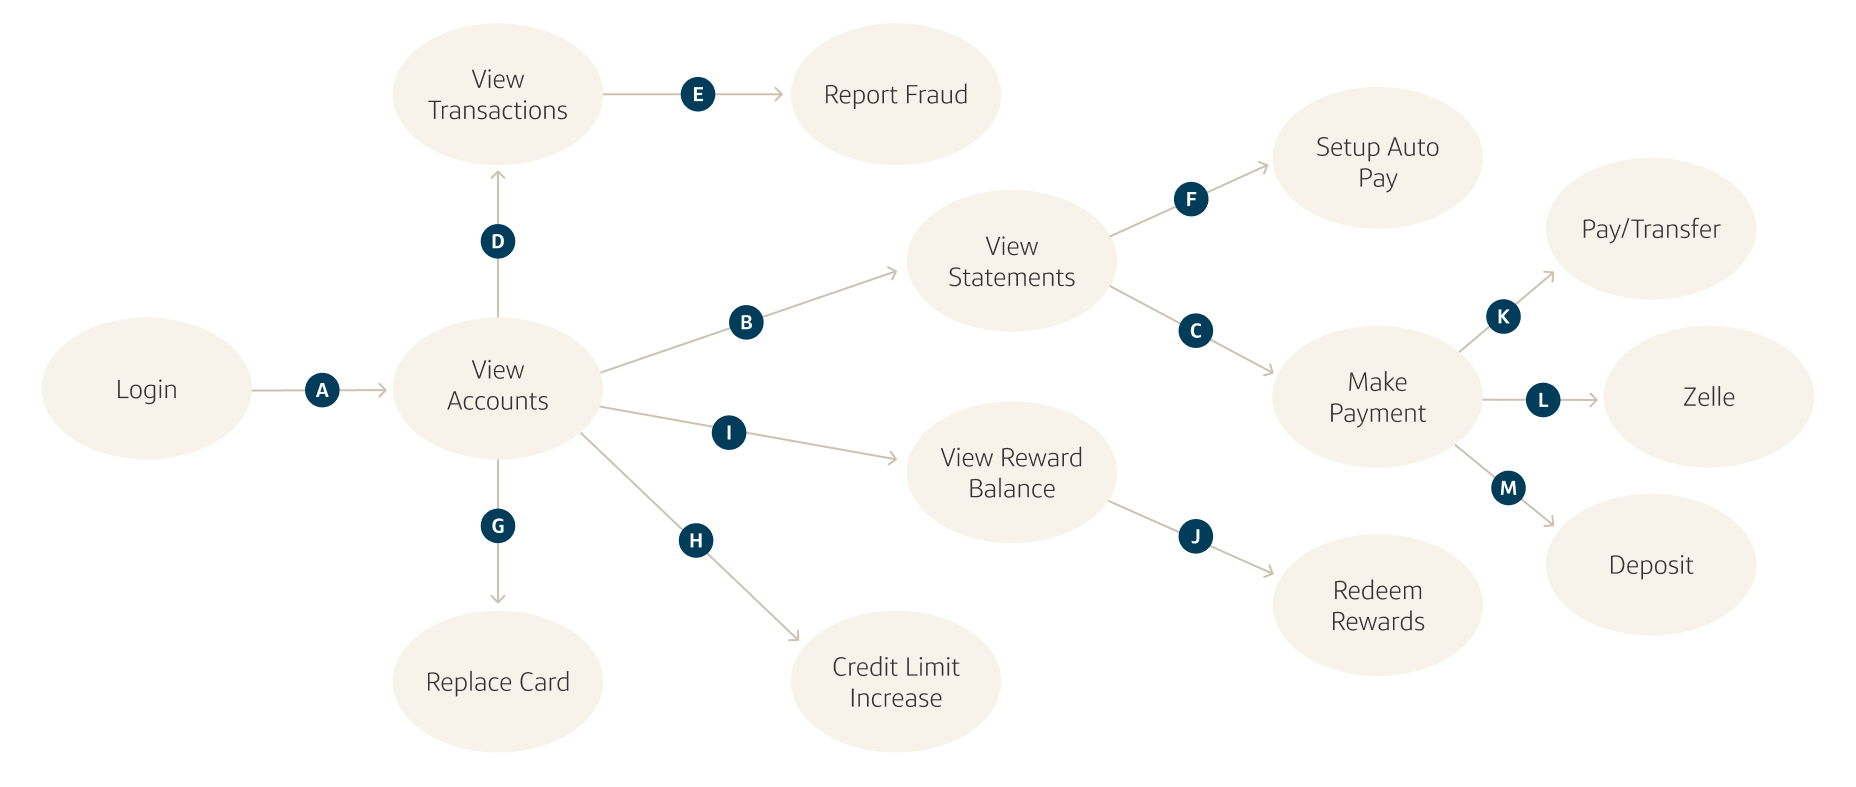
Figure A
In the sample journey graph shown above, individual EASE features and journeys are represented by nodes, and the edges between them represent possible customer transitions. This graph, along with all possible customer paths, can be generated automatically. We can also overlay:
- Health information for individual nodes using RUM metrics and anomaly detection.
- Real-time traffic information on the edges to gain insight into:
- The volume of customer traffic flowing between different features.
- Whether traffic volume patterns for that path are normal for the given time of day/week.
Such observability insights can significantly aid in detecting and troubleshooting incidents, thereby reducing mean time to detect (MTTD) and mean time to resolution (MTTR).
Trace types and how they support observability
All trace types are metadata tags inserted into the HTTP headers of API calls. APIs must retain and propagate these traces to downstream services. The traces are injected upstream at the customer layer. Here are several different trace types:
- Session ID: A unique identifier for each customer session. This ID remains unique across all API calls and their dependencies throughout a customer session—from login to logout.
- Trace ID: A unique identifier for each customer action within a session, retained for all downstream API calls supporting that specific customer action.
- Span ID: A unique identifier for each downstream API call within a customer action.

Figure B
In the visual above, trace IDs and span IDs help identify dependencies between upstream and downstream APIs invoked for a single customer action. The customer session ID links the sequence of actions taken by an individual customer within a unique session.
Our approach to automating customer journey graphs
We exclusively use the customer session ID to construct the customer journey graph, as each session ID reveals the distinct actions (via APIs) a customer takes in a unique session on our web or mobile channels. Our sources for session IDs include RUM logs, clickstream data logs and API gateway logs.

Figure C
The table and figure above illustrate how we use individual session IDs to determine the sequence of customer actions, based on the timestamp of each underlying API call. In the example, the same session ID has three different timestamps, indicating that the same customer, in their unique session, takes action A, followed by B and then C. We then aggregate all customer session flows over a period to construct a graph of all possible paths customers have taken.

Figure D
Figure D above shows such an aggregated graph. This graph includes APIs (as nodes) and paths (as edges), along with details on traffic volume through each edge within the aggregation window. We can then filter out less likely paths to create a more useful subgraph, similar to Figure B.
We have also developed a custom algorithm to identify entry and exit points for individual steps in a journey. These journeys have been validated with existing subject matter experts supporting these services to ensure the accuracy of our automation logic.
Using customer journey graphs for troubleshooting
We have successfully leveraged customer journey data to detect issues affecting login, viewing account summaries and other services. We’ve developed custom visualizations that provide drill-down capabilities, offering detailed insights at various levels to assess impact, troubleshoot, remediate and identify root causes. Our framework and automation enable rapid building and deployment of additional journeys.
Applying machine learning for anomaly detection
We overlay machine learning-based anomaly detection on our customer journey graphs to detect abnormal traffic patterns. Monitors can be set up to alert appropriate support engineers when traffic patterns change. Drill-down capabilities and navigation to our internal API-to-API dependency graph further enable faster fault localization.
Conclusion: Advancing customer-centric observability
For the first time at Capital One, we have built an automated process to visualize the sequence of interactions our customers experience with web and mobile channels, using graph-based approaches. These have already proven useful in recent incidents. We intend to further enhance these graphs, embed them in various observability tools and combine them with other insights to enable our SRE teams to troubleshoot incidents faster. These graphs also hold the potential to aid product teams in gaining additional insights into customer behavior and building better features.